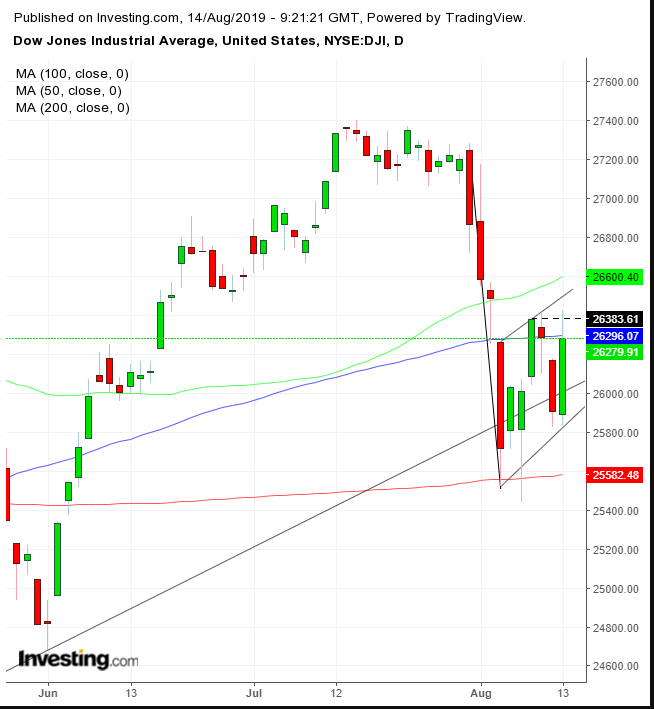
It looks like yesterday's Dow Jones relief rally, the strongest in two months, will fizzle today, pressured by hard data.
Last week, the mega cap index dropped 5% in just four days. Yesterday's exuberant rebound was triggered by President Donald Trump's policy flip-flop, delaying 10% tariffs on Chinese imports till after the holiday shopping season, but also highlighting how unreliable the rally actually was.
Today’s hard data from China and Germany, showing the world's second and fourth largest economies are edging closer to a recession, flipped the switch back to risk-off. China’s industrial output—the Asian nation's economic bread-and-butter—plunged to its slowest pace in 17 years; Germany’s GDP fell to 0.1% from 0.4% QoQ, returning Europe's economic engine to negative growth.
As a result, yields edged back to a single basis point away from the lowest level since October 2016. A new low would press all the market's panic buttons.
While we’re not necessarily recommending shorting U.S. stocks, we would urge any bulls to be extremely cautious. The technical chart shows why.

Despite the Dow’s leap on Tuesday, it found resistance at the week’s highs, also the top of a rising flag, bearish after a 6% intraday plunge in only four days last week. Note: the flag is developing right on the uptrend line since the December bottom, demonstrating why there would be a bull vs bear struggle at these levels.
Another measure of how sensitive this spot on the price map is—the range formed between the 200 MA, providing support, and the 50 and 100 DMAs, which have already plunged through and are now keeping the price from rising.
This pressure point in the supply-demand balance, as traders meet in the middle to buy and sell their stock holdings, occurred after supply drowned out demand till prices fell below the 50 and 100 DMAs. It echoes the overall market dynamic, a shakeup right on the medium-term uptrend line.
A close above the 50 DMA at 26,6000 will likely blow out the bearish pattern, while a close below the 200 DMA at 25,500 would complete the flag, signaling another leg down. If this flag does complete with a downside breakout, it would signal a short-term move. However, it will bring the price close to a potential downside breakout of a massive top with long-term repercussions.
Trading Strategies
Conservative traders would wait for a descending series of peaks and troughs in the long term, after falling below the December bottom, before considering a short. Alternatively, they would wait for the flag blowout for a long position. They would use a minimum of 3% and 3-day filters, preferably including a weekend, to avoid a trap.
Moderate traders would wait for the same breakouts as conservative traders but may be content with just a 2% and 2-day filter.
Aggressive traders may enter a contrarian short position, relying on the top of the flag to provide resistance.
Trade Sample
Entry: 26,400
Stop-Loss: 26,430 – above yesterday’s highs
Risk: 30 points
Target: 26,100, above the uptrend line
Reward: 300 points
Risk:Reward Ratio: 1:10
