Get 40% Off
⚠ Earnings Alert! Which stocks are poised to surge?
See the stocks on our ProPicks radar. These strategies gained 19.7% year-to-date.
Unlock full list

Chart Of The Day: Gold Set To Jump; Current Drop Could Be Buying Opportunity

Published 02/11/2019, 10:01 AM
Updated 09/02/2020, 02:05 AM

The dollar has climbed 1.5% since Jan. 31. During the same period, gold dropped 0.85%.

For half of those days, the precious metal was up, together with the U.S. currency. Considering that gold is priced in dollars—making it more expensive as the USD strengthens—and is also seen as a safe haven when the outlook on growth is pessimistic, while the greenback is typically considered a risk asset, the yellow metal has actually fared rather well.

Gold

We'd argue that the dollar rally does not project increased faith in economic growth. Rather it's due to the currency's off-and-on safe haven status.

For example, over 40% of demand for Treasurys is driven by foreign investors, whose purchases include dollar transactions. This helps boost the currency but doesn't necessarily signal risk-on sentiment.

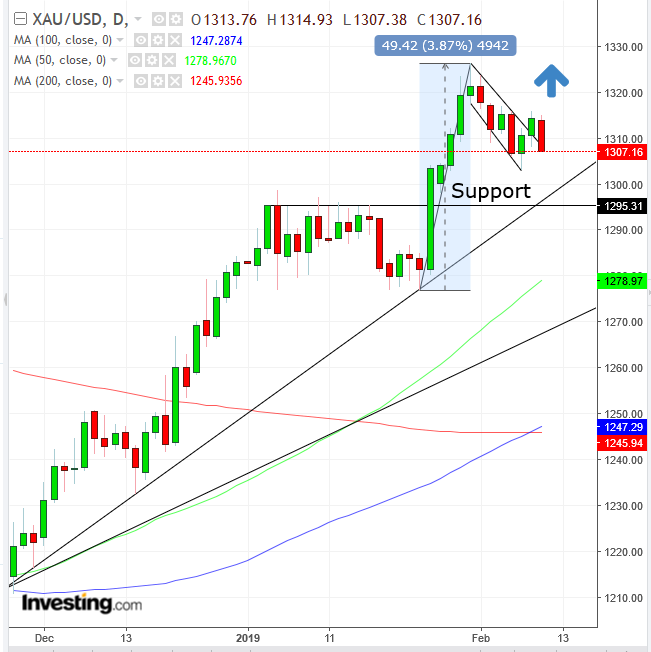
As we write this gold is falling, heading toward $1,307. We consider this a buying opportunity since it is falling toward a falling flag, bullish in an uptrend, as well as toward its uptrend line since Nov. 28.

Extending the bullish view, last week the 100 DMA crossed above the 200 DMA, after the 50 DMA crossed above the 200 DMA, triggering a golden cross. This revved up the sharp jump on Jan. 25 from the $1,2875 levels to the $1,325 area, a $50, or near 4% jump in 5+ sessions.

Trading Strategies

Conservative traders would wait for a decisive upside breakout of the flag, with a close above $1,317, which would signify that demand has absorbed all the supply since Feb. 5 and buyers have raised their bids to find more willing sellers. Then, they should wait for a likely return move, to demonstrate the flag’s integrity, with at least one long, green candle engulfing a red or small candle of either color.

Moderate traders would wait for the same breakout with a closing basis that mirrors that of conservative traders. While they might wait for a return move for a better entry, they would not necessarily wait for proof of pattern integrity.

Aggressive traders could enter a long position immediately, taking advantage of what may prove to be an entry before gold catapults higher.

Trade Sample

  • Entry: $1,307
  • Stop-Loss: $1,306
  • Risk: $1
  • Target: $1,315 – resistance since Feb. 5
  • Reward: $8
  • Risk-Reward Ratio: 1:8

Latest comments

Sorry Tony and Tuemeo. This article is spot on. The chart shown is uncannily (not really) close to one I wrote two weeks ago. $1000 Gold by November '19 ? I'll save you some money and pay your $1050 for every oz that you own today.
Thank you Tony. Losing faith in many of these "analysts" and this platform in general. It's not hard to see gold is going down long term, even with basic technical analysis.
my dear Pinchas, please do not spoil your good very good track record with this misguided comment. Entrapment in the making for gold's Demise! Gold Will see a retest of $1000 in Nov 19!!
Risk Disclosure: Trading in financial instruments and/or cryptocurrencies involves high risks including the risk of losing some, or all, of your investment amount, and may not be suitable for all investors. Prices of cryptocurrencies are extremely volatile and may be affected by external factors such as financial, regulatory or political events. Trading on margin increases the financial risks.
Before deciding to trade in financial instrument or cryptocurrencies you should be fully informed of the risks and costs associated with trading the financial markets, carefully consider your investment objectives, level of experience, and risk appetite, and seek professional advice where needed.
Fusion Media would like to remind you that the data contained in this website is not necessarily real-time nor accurate. The data and prices on the website are not necessarily provided by any market or exchange, but may be provided by market makers, and so prices may not be accurate and may differ from the actual price at any given market, meaning prices are indicative and not appropriate for trading purposes. Fusion Media and any provider of the data contained in this website will not accept liability for any loss or damage as a result of your trading, or your reliance on the information contained within this website.
It is prohibited to use, store, reproduce, display, modify, transmit or distribute the data contained in this website without the explicit prior written permission of Fusion Media and/or the data provider. All intellectual property rights are reserved by the providers and/or the exchange providing the data contained in this website.
Fusion Media may be compensated by the advertisers that appear on the website, based on your interaction with the advertisements or advertisers.
© 2007-2024 - Fusion Media Limited. All Rights Reserved.