- All Instrument Types
- Indices
- Equities
- ETFs
- Funds
- Commodities
- Currencies
- Crypto
- Bonds
- Certificates
Please try another search

Which stocks will surge next?
Chart Of The Day: S&P 500 Rally Running Out Of Steam

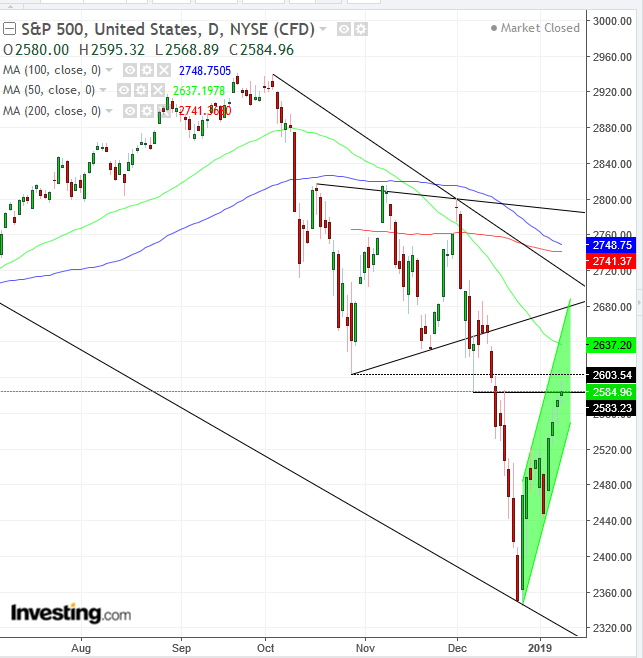
On Christmas Eve the S&P 500 plunged, falling 2.7%, its worst performance for that date on record. Since then it's bounced back, for its biggest market rally post-Christmas, to close yesterday just a hair below 2,585.
The primary reason for the current jump is most likely a result of technical drivers in the form of a short squeeze, though fundamentals have now caught up to push prices yet higher. The rally that's helped boost the index in recent days has been driven by a weakening dollar, easing trade tensions, an outlook for a slower rate hike path and last Friday's solid NFP report.
After the benchmark's 15% slide in December, we predicted prices would bounce, likely via a final rally before an outright bear market set in. The S&P 500 has now pushed higher by as much as 10% from its December 24 bottom. Today, we’re increasing the outlook for the end of the upward correction, when the short-term trend may re-sync with the medium-term downward trend.
Asian markets might be showing the first signs of a slowing rally, as global stocks and US futures turned lower earlier this morning.

The SPX is trading within a descending channel. Its rally hit a brick wall on the October and December lows, the former, where supply orders were waiting, overwhelming demand and pushing it back from the highs; the latter, more recent encounter, had enough supply close the price at those levels.
Above those levels, the 50 DMA marks another price level containing a pressure point in the supply-demand balance. Note: it just fell below the October-December triangular consolidation, where supply and demand entered a battle, with the bears the obvious victors as they trampled over bulls, creating the aforementioned 15% drop. The pattern forms a resistance, as traders set up orders and stop-losses according to recent market activities.
Above that is the channel top, protected by the 100 DMA, as it falls toward the 200 DMA—a confluence of resistances to the price. The 50 DMA already crossed below the 200 DMA in December, triggering the ominous Death Cross, as the medium trend turned lower.
The RSI also shows momentum winding down, as it nears the low 50s, a July-October support turned resistance since November.
Also note the small size of the bodies of the last three candles. Each additional candle is getting smaller, as the rally runs out of steam.
Trading Strategies – Short Position Setup
Conservative traders should wait for a full correction to the channel top, at around 2,650, per the current angle. Then, they’d wait for the short-term uptrend to end, with a descending series of peaks and troughs.
Moderate traders would wait for either a full correction to the channel top, but not necessarily wait for a short-term trend reversal. They may be satisfied with first signs of it, such as with a long, red candle following a green or small candle of either color.
Alternatively, they could enter a short anytime the near-term activity reverses with a descending series of peaks and troughs.
Aggressive traders may short after the first signs of a top, such as with at least one long, red candle engulfing a green or small candle of either color. Then, they could wait for bulls to retest bears, which may push prices closer to yesterday’s highs, to reduce exposure.
Trade Sample
- Entry: 2,580
- Stop-loss: 2,600
- Risk: 20 points
- Target: 2,500 – late December-early January consolidation support
- Reward: 80
- Risk-Reward Ratio: 1:4
Related Articles

Energy giants Exxon Mobil and Chevron report earnings tomorrow. Exxon boasts a strong financial position, potentially mitigating risks from rising interest rates. Analysts are...

Animal spirits have come off the boil lately, but these are still early days for deciding if risk-on sentiment for equities has hit a wall or is in a holding pattern that allows...

The European market can offer quality stocks for those looking to increase portfolio diversification. Their stock market might be a bright spot, with several established companies...
Are you sure you want to block %USER_NAME%?
By doing so, you and %USER_NAME% will not be able to see any of each other's Investing.com's posts.
%USER_NAME% was successfully added to your Block List
Since you’ve just unblocked this person, you must wait 48 hours before renewing the block.
I feel that this comment is:
Thank You!
Your report has been sent to our moderators for review


Add a Comment
We encourage you to use comments to engage with other users, share your perspective and ask questions of authors and each other. However, in order to maintain the high level of discourse we’ve all come to value and expect, please keep the following criteria in mind:
Enrich the conversation, don’t trash it.
Stay focused and on track. Only post material that’s relevant to the topic being discussed.
Be respectful. Even negative opinions can be framed positively and diplomatically. Avoid profanity, slander or personal attacks directed at an author or another user. Racism, sexism and other forms of discrimination will not be tolerated.
Perpetrators of spam or abuse will be deleted from the site and prohibited from future registration at Investing.com’s discretion.