China’s decision to maintain interest rates, after the Fed had raised both rates and the outlook for an additional hike this year, caught FX traders off guard, especially considering the selling pressure on the Chinese yuan. Perhaps the decision by the People's Bank of China (PBoC) was in response to last week's triple blow to China's growth, in which industrial production, retail sales, and infrastructure investments hit multi-year to record lows.
PBoC's Governor Yi Gang chose the lesser of two evils, continuing capital outflow to avoid a potentially much more dangerous credit crunch. After all, major global markets are just emerging from a decade-long easing implemented to avoid that very scenario after the 2008 crash, thereby circumventing another Great Depression.
While that was the right choice for the PBoC, the preferred option for traders may be to join the renminbi sell off.

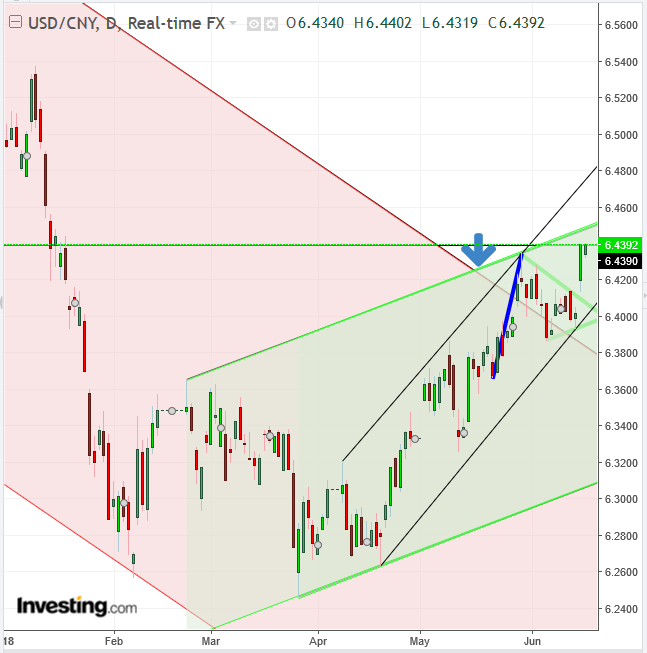
As the selling commenced, the dollar erupted out of a pennant, a continuation pattern, like a volcano, with a breakaway gap. The jump already surpassed the preceding, May 30, 6.4345 rate, extending the uptrend that began on March 27.
Since technical analysis is the study of supply and demand, an experienced technician seeks the price levels with the greatest buying and selling pressure points. Like rounding up the usual suspects, these are found where supply and demand have the greatest conflicts. For traders the greater the conflict, the greater the move following the resolution.
In the chart above, the greatest USD/CNY conflict manifested in the crossroad between the downtrend since early May of last year and the uptrend since late March of this year, marked by the arrow. That trend clash formed the pennant, the price structure in which both sides executed their orders.
The upside breakout, by definition, could have only occurred after all the supply that pushed prices down from 6.9000 early last May was absorbed. Traders who were still bullish were required to seek willing yuan sellers at higher prices. Their willingness to pay those higher prices, completing a continuation pattern, demonstrates that demand is outpacing supply.
The remaining question is whether the price will first correct toward to the bottom of the rising channel since late March or cross above the channel top, pointing at a steeper incline, showed by the black line.
The way savvy traders would deal with this unknown risk is to trade according to probabilities surrounding a pennant pattern.
The pennant’s implied target, by measuring the recent, sharp move (without a consolidation, in which traders would have already taken profits), between May 22, from the low of 6.3657 and the May 30 high of 6.4345 (blue line), a 685 pip-move, or 1 percent (though targets are measured according to price and not percent changes). Therefore, the same supply-demand dynamic is expected to repeat itself on the upside of the pennant, from the 6.4100 breakout point, rendering a target of 6.4700.
Trading Strategies – Long Position Setup
Conservative traders would wait for a return to the channel bottom or a decisive upside breakout of the channel top.
Moderate traders would wait for either a return-move to the pennant or for an upside breakout of the channel top.
Aggressive traders may risk a short now, provided they can afford a stop-loss below the 6.4000 level or a loss.
