More and more banks have banned consumers from purchasing Bitcoin with their credit cards. This has led to the last leg of the selloff this month, from $10,000 and lower. This last leg followed what some consider to be a concerted effort by global regulators to squelch the little retail investor's most recent stand against the system, and what others consider an attempt to avoid another forex/binary option scandal. Whichever way you see it, the continued regulations have helped bring the number one cryptocurrency by market cap down from $20,000 to $10,000 and yet lower.
Either way, the leading cryptocurrency is rising today, for a second day, leaving traders questioning whether the selloff is over.
So Is The Selloff Over?
First, the last leg in the selloff proved to be a blessing in disguise for the Bitcoin market, if not for those individuals who lost their pants (and to them, our sympathies). The selloff was of course due in part to the reduced demand of credit card purchases, but much more likely it was a result of banks highlighting the risk of a digital asset whose chaotic swings invalidate any assumption that it is a currency.
We warned our readers about these risks, specifically because of these very credit card purchases.
Did these guys really not get that this was risky? Trust me, the market is better off without unskilled traders putting their hopes and dreams of risk-free, quick riches into it, thereby destroying the hopes and dreams of responsible traders. This crash was a shake up, keeping us honest and reminding everyone that there are no free rides.
Second, even if we're left with only responsible trades, it’s too late. Bitcoin is now in a bear market.
Third, that doesn’t mean that traders can’t trade Bitcoin up and down.
Name Your Terms
There is a lot of confusion among traders regarding trends. Traders often ask whether the trend is up or down.
Before answering that, the trader needs to qualify the question. What trend is the trader looking at? Trends range from secular (ranging decades), to long-term (ranging months to years), to midterm (ranging weeks to months), to short-term (ranging days to weeks), to day trading to scalping.
An asset could be in an uptrend in one period while in a downtrend in another. Therefore, first name your term. Only then can you figure out its trend.

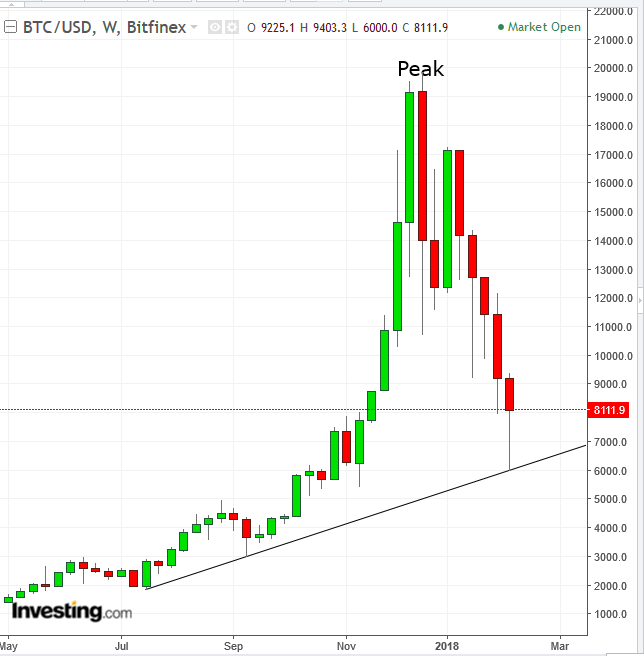
Yesterday, the price bounced off the support of an uptrend line since July as other traders fulfilled their own prophecy of trading buying off its support, suggesting the long-term uptrend is intact.
However, if traders consider an asset that declined 20 percent to be in a bear market, what would they say about one that declined 70 percent, from $20,000 to $6,000? Most definitely a bear market, or a buying opportunity?

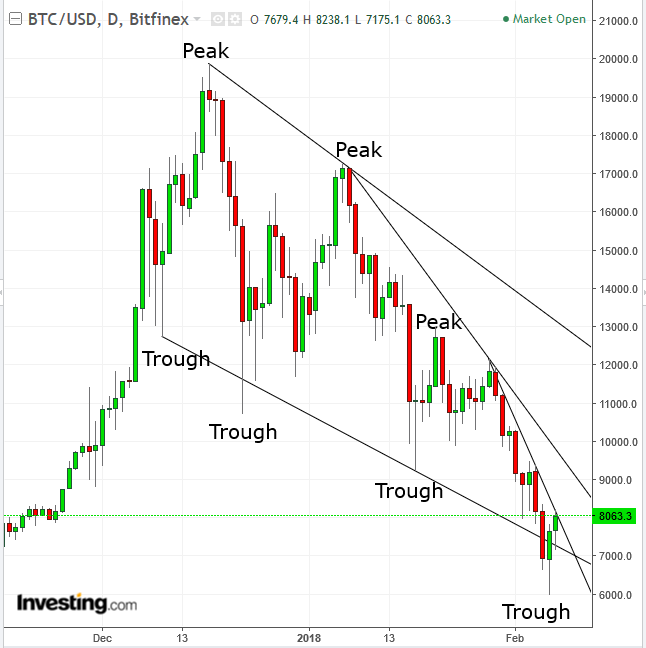
In the medium-term, the trend is most definitely down, as it has traded within a falling channel since December, with peaks and troughs in descending price levels. That dynamic means that the supply/demand balance is tipped for shorting, rather than buying. Only when that balance will tip the other way and break above the channel top and post two peaks and troughs in ascending price levels, will Bitcoin be in an uptrend.
Note that even within a downtrend, there are depths: (1) the channel top, at $12,500 and falling, (2) the faster downtrend line from January 6 to January 28, currently at $8,600 and falling, and finally (3) the steepest downtrend line since January 28, resisting the current rally, at the $8,000 level.
Drawing these different depths of trend lines is called “fanning.” Each trendline may be presumed to provide a resistance, where traders sell or even short the asset. The upside breakout of each trend line opens up the next trend line as a target.

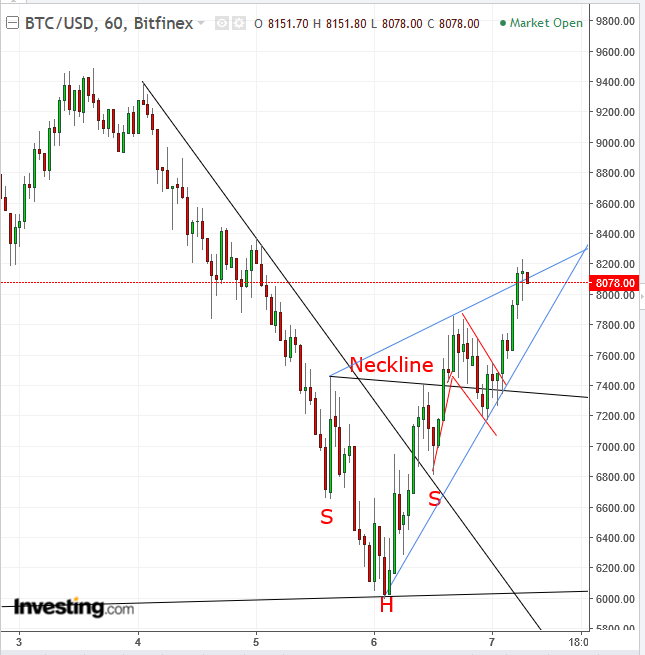
In the short-term, the trend is up, supported by a H&S bottom, which includes a bullish Falling Flag (red), while potentially forming a bearish Rising Wedge (blue).
The H&S implies a $7,840 target, and the flag implies a target of $8,900.
However, should the wedge complete with a downside breakout beneath $7,600 per the current angle, it would signal a resumption of the midterm to long-term downtrend. This is the risk traders assume by trading against the trend. That means it’s not for everyone.
Swimming against the current requires training for strength, endurance and focus. Only traders who have an equity management plan they understand and control can risk the swim against the current.
Trading Strategies
Conservative traders trade only with the main trend. They can enter a short position upon a downside breakout of the rising wedge, with a stop-loss above its bottom and a first target of $6,000, the previous trough, having proven demand, and a secondary target of $4,600
Moderate traders may go long with an upside breakout, invalidating the rising wedge’s bullish nature, with a stop-loss beneath the wedge top and the aforementioned targets.
Aggressive traders may enter a short position, with a stop-loss above the $8,238.10 hourly high with a first target of the wedge bottom at the $7,800 level, and with a longer target upon a downside breakout, as discussed in the conservative strategy.
Alternatively, they can enter a hedge, two opposite positions, closing the short with an upside breakout above the $8,300 level, and closing the long position with a close below the $7,960 level below the hourly low.
Should an upside breakout to the wedge occur by the time of publishing, they would follow the moderate strategy.
Note: This is a tricky trade, because what may appear as a downside breakout to a bearish Rising Wedge may turn into a return-move to a bullish Falling Flag. Therefore, only traders with a strict equity management plan who can afford it should risk this trade.
Disclaimer: All investments have many risks and can lose principal in the short and long term. The information contained herein is not guaranteed, does not purport to be comprehensive and is strictly for information purposes only. Anyone reading this agrees, understands and accepts that they take upon themselves all responsibility for all their investment decisions and to do their own due diligence, and not to hold Pinchas Cohen responsible. Pinchas Cohen does not assume any liability for any direct, indirect or consequential loss that may result from the reliance by any person upon any such information or opinions. Any expressions of opinions are subject to change without notice. This document does not constitute an offer or an invitation to trade or invest. No party should treat any of the contents herein as advice.
