by Pinchas Cohen
Commodities Are Falling On A Correction
The current global equity selloff is being led by shares of commodity producers, on a sudden fear of a commodity glut grips world markets. The key word here, however, is “sudden.”
Real economic changes occur over time. Sudden sharp moves brought on by panicking investors is most always exaggerated, at best, or blatantly out of place, at worst. While commodity indices have been falling at the fastest pace in a month, they are returning to equilibrium. Markets (both stocks and commodities) got too hot and need to cool down, but they have not reversed their trends, and we can expect institutions to pick up the dips.
Morgan Stanley advised clients to stay overweight equities and avoid joining the crowds' knee-jerk selloffs. The firm is convinced there's another cycle to the bull market.
Intermarket analysis supports the bank’s assertion, particularly when viewed through commodity gauges. The Bloomberg Commodity, Braclays Capital Commodities, BlackRock Resources & Commodities Strategy Trust (NYSE:BCX) and the United States Commodity Fund (NYSE:USCI) all paint the same picture of a correction toward an uptrend line.

All Ducks In A Row For A Buying Opportunity
The United States Commodity fund is an exchange-traded ETF designed to track, in percentage terms, the price movements of the SummerHaven Dynamic Commodity Index.
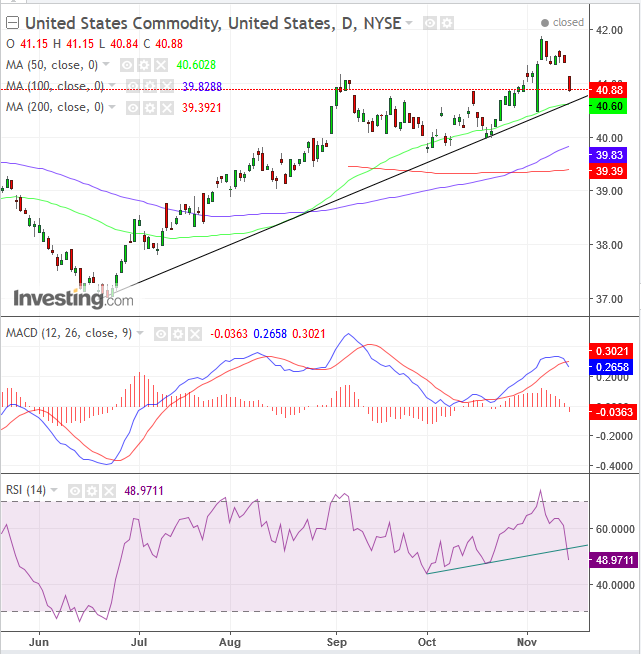
The ETF has been rising since June 19. While it is dropping sharply – as panic selloffs do – it is falling after posting a new peak within the uptrend on November 6 with a high of $41.88. The current decline is toward its uptrend line – guarded by the 50 dma (green), after a Golden Cross of the 100 dma (blue) crossed over a rising 200 dma (red), to boot, putting all the ducks in a row for a buying opportunity.
However, there are two technical indicators that don’t support this thesis: the momentum RSI and moving-average interplay MACD. Both are providing sell signals.
The MACD did so when the shorter (blue) moving average crossed below the longer (red) moving average, suggesting the more recent period is worse for commodity prices relative to a longer period, a fact which tends to pick up momentum. For the RSI, the cross below its uptrend line may suggest a reversal, ahead of the price.
Having disclosed those uncooperative indicators, experience dictates these are sensitive to sudden, sharp moves (which this is), and therefore, the bigger picture may be distorted. We rely much more on trend line, peak-trough and moving average analysis.
Trading Strategies
Conservative traders would wait for the price to bounce off the uptrend line and close higher, and maybe for the RSI and MACD to fall in line, before risking a long entry.
Moderate traders would wait for the uptrend line to prove its integrity, when the price finds demand, which produces a higher close than at least the preceding day’s trading range.
Aggressive traders may wait on a long position either for an up day to cover the last down day, or for the price to reach the uptrend line at $40.60 per the current angle and rising.
