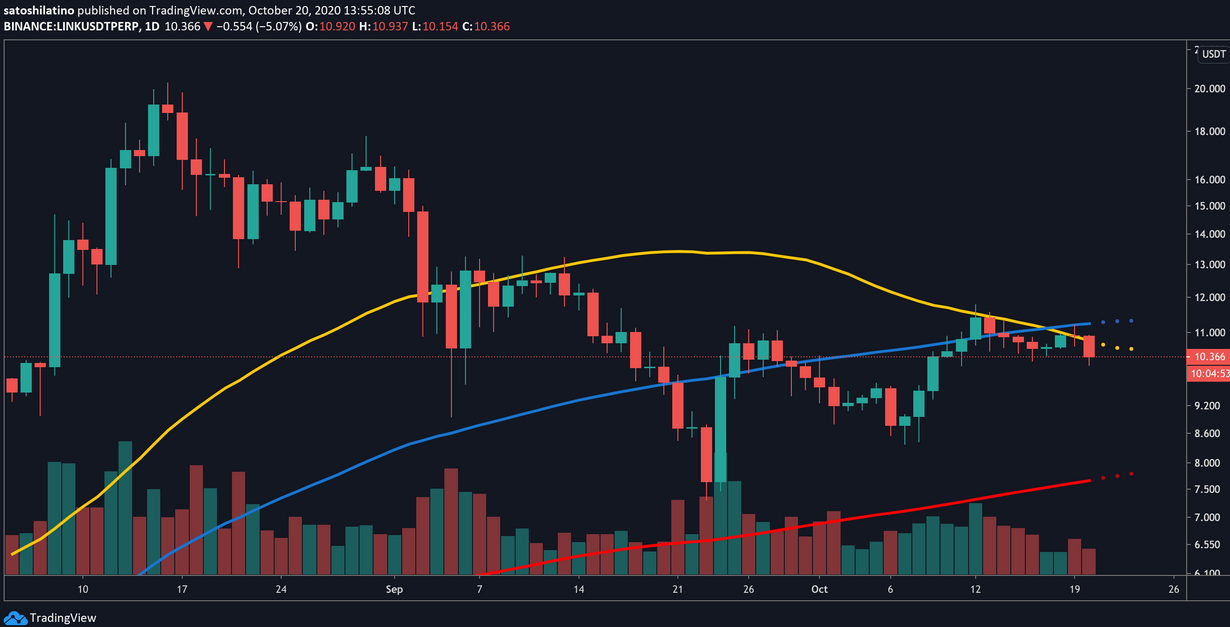
Chainlink's upside potential is capped at $11, but a spike in buying pressure could be significant enough to break through this hurdle.
Key Takeaways
- Chainlink may be on the verge of another rejection from the 50-day moving average.
- While the $10 level seems to be acting as stiff support, slicing through it could lead to a drop towards $8.
- Despite the high probability of a correction, on-chain metrics show that the buying pressure behind this cryptocurrency is surging.
Chainlink is currently trading underneath a critical resistance barrier. Failing to move past it could be catastrophic for the decentralized oracles token while slicing through it will likely ignite FOMO among market participants.
Critical Resistance Ahead of Chainlink
Chainlink has been stuck in a downtrend over the last two months. And since early September, the 50-day moving average has managed to stop this altcoin from achieving its upside potential.
Each time the decentralized oracles token has risen to this resistance barrier since then, a significant rejection follows.
Over the past week, LINK bulls once again tried to slice through the 50-day moving average on several occasions. However, this hurdle continues to hold, suggesting that a correction is underway.
A further spike in the selling pressure could see this token’s price plummet towards the 200-day moving average, at $8.

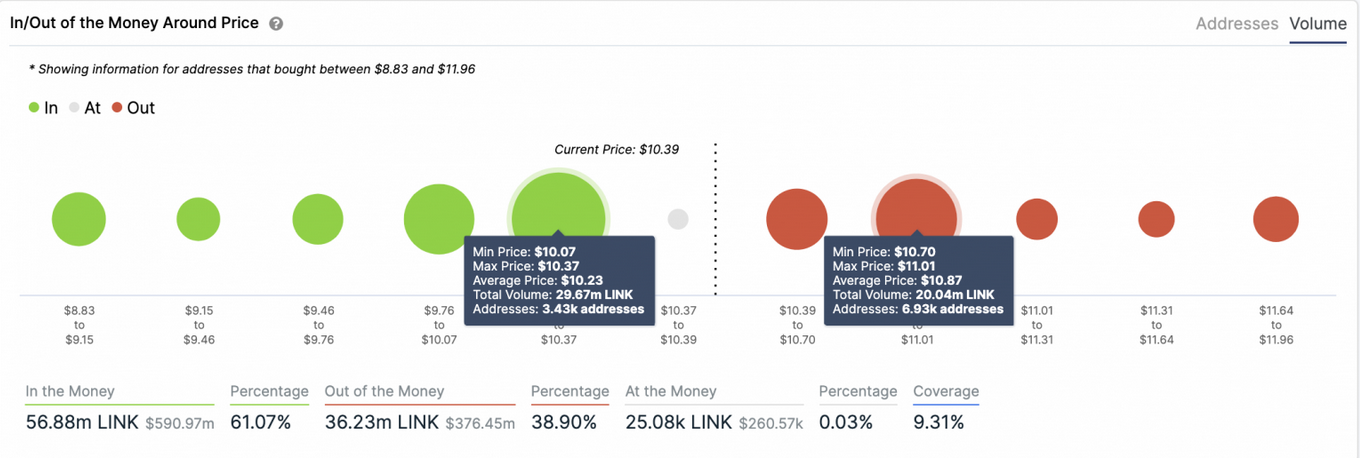
Despite the high probability of a steep decline, IntoTheBlock’s “In/Out of the Money Around Price” (IOMAP) model reveals that Chainlink sits on top of a massive supply barrier. Based on this on-chain metric, roughly 3,500 addresses had previously purchased nearly 30 million LINK between $10 and $10.4.
Such an important area of interest may have the strength to keep falling prices at bay. Holders within this range may even buy more tokens to avoid seeing their investments go into the red.
But if the $10-$10.4 support fails to hold, the odds for a downswing to $8 will drastically increase.

On the flip side, the IOMAP cohorts add credence to the 50-day moving average’s ability to reject any upward price action.
Approximately 7,000 addresses are holding 20 million LINK between $10.7 and $11. Therefore, only a daily candlestick close above this price range could jeopardize the bearish outlook and lead to a breakout.
Whales Go Into Buying Frenzy
It is worth noting that investors with millions of dollars in Chainlink, colloquially known as “whales,” have been increasing their positions over the past week.
Santiment’s holder distribution chart shows that since Oct. 15, the number of addresses holding 10,000 to 100,000 LINK shot up. Roughly 49 new whales have joined the network, representing a 1.7% jump over a short period.

Given Chainlink’s rising buying pressure, it is imperative to pay close attention to the overhead resistance and the underlying support. A daily candlestick close above $11 or below $10 will determine where this cryptocurrency is headed next.
