
Centennial Resource Development, Inc. (NASDAQ:CDEV) reported adjusted third-quarter 2019 earnings of 1 cent per share, missing the Zacks Consensus Estimate of 2 cents and declining from the year-ago quarter’s 15 cents.
Revenues from oil and gas sales fell to $229.1 million from $234.9 million a year ago. However, the top line beat the consensus mark of $228 million.
The weak earnings were attributed to lower commodity price realization and increased lease operating expenses. However, the negatives were partially offset by a surge in production.
CENTENNIAL RES Price, Consensus and EPS Surprise
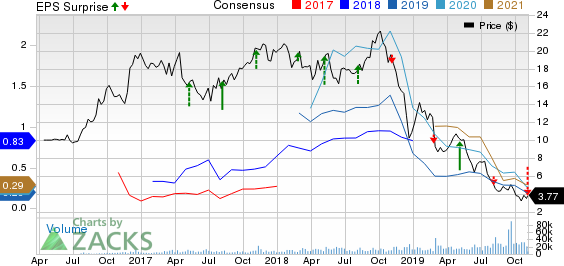
CENTENNIAL RES price-consensus-eps-surprise-chart | CENTENNIAL RES Quote
Production Rises
Total production in the reported quarter averaged 76,312 barrels of oil equivalent per day (Boe/d), up from 62,930 Boe/d in the year-ago period. Of the total output, 55.1% comprised crude oil. The upside can be attributed to strong well results in the Delaware Basin. Moreover, improved well results from New Mexico and Texas attributed to the rise. Notably, the company decreased operated rig count in September to five from six, owing to improved operational efficiencies.
Oil production averaged 42,079 barrels per day (Bbls/d), up from 36,027 Bbls/d in third-quarter 2018. Natural gas production amounted to 124,896 thousand cubic feet per day (Mcf/d), up from the year-ago quarter’s 85,180 Mcf/d. Moreover, natural gas liquids production was 13,417 Bbls/d, higher than the year-ago quarter’s 12,706 Bbls/d.
Price Realization Declines
The company reported average realized crude price of $51.71 a barrel (excluding the effects of derivate settlements), down from $55.68 in the September quarter of 2018. Average natural gas price dropped to 96 cents per Mcf from $1.83 a year ago. Natural gas liquids were sold at $14.47 a barrel, down from $30.85 in third-quarter 2018.
Total Operating Cost Rises
Centennial incurred $217.8 million of total operating costs in third-quarter 2019, higher than $165.5 million in the year-ago period. On a per Boe basis, the company’s third-quarter lease operating expenses were $6.03, much higher than the year-ago level of $4.09. Gathering processing and transportation costs increased to $2.97 per Boe from the year-ago period’s $2.78.
Capital Expenditure
In third-quarter 2019, it incurred capital expenditure of $212.1 million, including $160.5 million in drilling and completion activities. Notably, the company has reduced capital spending related to drilling and completion for four straight quarters.
Balance Sheet
At the end of the quarter under review, cash balance totaled $11million. Long-term debt amounted to $900 million, reflecting a net debt to book equity capitalization of 24%.
Guidance Revised Upward
Centennial increased its production guidance for 2019 to the range of 72,250-7,250 Boe/d from previous expectation of 68,000-75,000 Boe/d. Oil production is now expected within 41,250-43,250 Bbls/d for full-year 2019, up from the previous projection of 39,500-42,500 Bbls/d.
It expects total gross wells spud in 2019 in the range of 70-80, unchanged from the previous guidance.
It increased its view for lease operating expenses for the full year to the range of $5.00-$5.60 per Boe from the previous expectation of $4.35-$4.95. Gathering processing and transportation cost expectation is reiterated at the range of $2.50-$2.80.
The company reiterated the full-year capital expenditure program of $765-$925 million.
Zacks Rank and Stocks to Consider
Currently, Centennial has a Zacks Rank #4 (Sell). Some better-ranked players in the energy space are Pembina Pipeline Corp. (NYSE:PBA) , TransCanada Corporation (TSX:TRP) and Contango Oil & Gas Company (NYSE:MCF) . All these companies carry a Zacks Rank #2 (Buy). You can see the complete list of today’s Zacks #1 Rank (Strong Buy) stocks here.
Pembina’s 2019 earnings per share are expected to rise 22% year over year.
TransCanada’s 2019 earnings per share are expected to rise 5% year over year.
Contango Oil & Gas’ bottom line for the current year is expected to rise around 87% year over year.
More Stock News: This Is Bigger than the iPhone!
It could become the mother of all technological revolutions. Apple (NASDAQ:AAPL) sold a mere 1 billion iPhones in 10 years but a new breakthrough is expected to generate more than 27 billion devices in just 3 years, creating a $1.7 trillion market.
Zacks has just released a Special Report that spotlights this fast-emerging phenomenon and 6 tickers for taking advantage of it. If you don't buy now, you may kick yourself in 2020.
Click here for the 6 trades >>
TransCanada Corporation (TRP): Free Stock Analysis Report
Pembina Pipeline Corp. (PBA): Free Stock Analysis Report
CENTENNIAL RES (CDEV): Free Stock Analysis Report
Contango Oil & Gas Company (MCF): Free Stock Analysis Report
Original post
Zacks Investment Research