Hardware platform and supply chain solutions integrator Celestica (NYSE:CLS) stock almost back to its 2020 pre-pandemic price levels. The global chip shortage of 2021 is a driver for the Company’s advanced technology solutions (ATS) segment. Digital transformation will drive its connectivity and cloud solutions (CCS) segment which is also includes the design and manufacturing division.
These combined make up the Lifecycle Solutions segment which saw 80% growth in 2020, which offset declines in its aerospace and defense (A&D) segment. The maker of consumer electronic products and gadgets expects to see accelerated growth with improved margins during the re-openings thanks to accelerated COVID vaccinations. Prudent investors looking for a stable return to growth for consumer electronics products can consider watching for opportunistic pullback levels in Celestica shares for exposure.
Q4 Fiscal 2020 Earnings Release
On Jan. 26, 2020, Celestica reported its fiscal Q4 2020 results for the quarter ending December 2020. The Company reported earnings-per-share (EPS) of $0.26 versus consensus analyst estimates for $0.25, a $0.01 beat. Revenues fell (-7.1%) year-over-year (YoY) to $1.39 billion, missing analyst estimates for $1.41 billion.
The Company ended the quarter and 2020 with $464 million in cash and cash equivalents and an undrawn $450 million credit revolver. The COVID-19 pandemic effects continued to impact demand in the commercial aerospace and industrials businesses but was partially offset by growth in the HealthTech and Capital Equipment businesses driven by new product ramps. Demand in the semiconductor Capital Equipment customers was strong and expected to remain strong in 2021 joined by strength in the display segment. Gradual recovery is taking shape with its industrials customers.
Flat Q1 2021 Guidance
The Company provided flat EPS guidance for Q1 2021 in the range of $0.18 to $0.24 versus $0.21 analyst estimates. Revenues are expected to come in between $1.175 billion to $1.275 billion compared to $1.25 billion consensus analyst estimates.
Conference Call Takeaways
Celestica CEO Rob Mionis set the tone:
“The scope of our capabilities across the product life cycle, now, the leading-edge solutions, which have been fueled by more than 10 years of significant R&D investment. Therefore, moving forward, we will be referring to JDM as Hardware Platform Solutions or HPS. Said more simply, JPM is an engagement model and capability that we offer within our broader hardware platform solutions offering.”
The HPS is composed of over 40 hardware platforms. HPS and ATS segment will be combined as Lifecycle Solutions, which continues over 50% of total revenues at an 8% average growth rate. The Company is targeting 10% YoY growth for ATS with a 5% to 6% target margin range.
Recovery in Aerospace and Defense
While the A&D segment was weak in 2020 due to COVID-19 effects, the Company is seeing a rebound, “We are encouraged by the bookings momentum in A&D as we have added nine new customers, including major airframers and defense contractors.” The HealthTech segment continues to accelerate with strong growth spawned by the pandemic which should continue to carry forward through 2021. The Company is targeting free cash flow generation of $100 million in 2021 driven by HPS strength and recovery in A&D. The bar may be set low here moving forward, which provides a chance for prudent investors to get in at opportunistic pullback levels.

CLS Opportunistic Pullback Levels
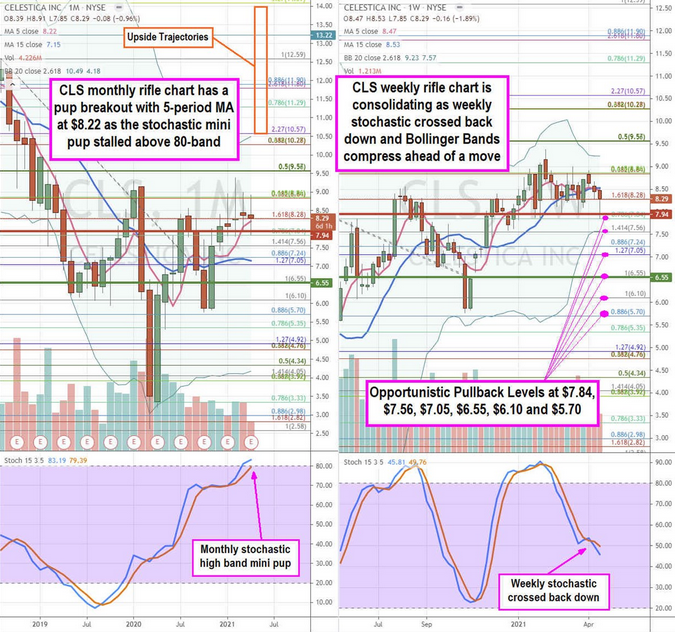
Using the rifle charts on the weekly and daily time frames provides a precision view of the landscape for CLS stock. The weekly rifle chart formed a pup breakout with slowing 5-period moving average (MA) at $8.22 and upper Bollinger Bands (BBs) near the $10.57 Fibonacci (fib) level. The weekly 15-period MA sits near the $7.05 fib. The weekly market structure high (MSH) sell triggers under $7.92.
The daily rifle chart attempted a pup breakout that turned back into a consolidation with a 5-period MA overlapping the 15-period MA at $8.50. The daily stochastic formed a mini inverse pup oscillation down through the 80-band and attempted to cross up only to get rejected back down. The market structure low (MSL) buy triggered on the $6.55 breakout. With the daily BB compression, a larger move is in store of CLS shares, with the only question of being direction.
Prudent investors can watch for opportunistic pullback levels at the $7.84 fib, $7.56 fib, $7.05 fib, $6.55 daily MSL trigger/fib, $6.10 fib, and the $5.70 fib. Upside trajectories range from the $10.57 fib up towards the $14.00 fib level.
