
CarMax Inc. (NYSE:KMX) , the specialty retailer of used and new vehicles, posted third-quarter fiscal 2020 (ended Nov 30, 2019) net earnings per share of $1.04, missing the Zacks Consensus Estimate of $1.16. Notably, lower-than-expected revenues across the wholesale vehicle segment resulted in the underperformance. Precisely, sales in the wholesale vehicle segment came in at $611 million, missing the consensus mark of $634 million.
The bottom line also compared unfavorably with a profit of $1.09 per share reported in the year-ago quarter.
Net sales and operating revenues in the reported quarter increased 11.5% year over year to $5,790 million. The top line beat the Zacks Consensus Estimate of $4,709 million. Total gross profit rose 7.8% year over year to $613.6 million.
In third-quarter fiscal 2020, CarMax opened four stores: two in existing markets —Texas andGeorgia, and two in new markets— California and Mississippi.
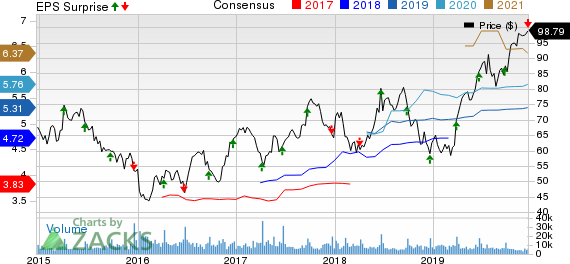
CarMax, Inc. Price, Consensus and EPS Surprise
Segmental Performance
In the fiscal third quarter, CarMax’s used-vehicle sales rose 13.6% from the prior-year period to $4,028.8 million, on the back of higher unit sales and improved average selling price. The units sold also climbed11% year over year to 192,563 vehicles. The average selling price of used vehicles increased 2.2% from the year-ago quarter to $20,710. Used vehicle gross profit per unit came in at $2,145 versus $2,133 in the year-ago period. Comparable store used-vehicle units and revenues sold rose 7.5% from the prior-year level. This robust performance reflects improved conversion and solid growth in web traffic.
Wholesale vehicle revenues inched up 1.2% from the prioryear to $611 million in the reported quarter. Units sold also increased 3.3% year over year to 113,996 vehicles, courtesy of growth in store base and appraisal buy rate. Moreover, the average selling price of wholesale vehicles declined 2.6% from the prior-year quarter to $5,079.Wholesale vehicle gross profit per unit came in at $937 versus $949 in the year-ago period.
Other sales and revenues increased 4.1% year over year in the quarter. Moreover, the extended protection plan’s revenues rose 13.3% to $97 million from the year-ago level.
CarMax Auto Finance reported a 3.9% year-over-year increase in income to $114 million in the quarter, reflecting collective effects of 7.5% rise in average managed receivables, partly offset by a decline in total interest margin percentage.
Costs, Financials and Share Buyback
Selling, general and administrative expenses flared up 18.4% from the prior-year quarter to $484.8 million. Store openings and spending to boost the firm’s technology, along withomni-channel strategic initiatives led to the rise in SG&A costs.
CarMax had cash and cash equivalents of $56.6 million as of Nov 30, 2019, up from $35.05 million in the corresponding period of 2018. Long-term debt (excluding current position) amounted $1,704.3 million, reflecting an increase from $1,649.2 million in the year-ago comparable period. Its debt-to-capital ratio stands at 31.5%.
In the quarter, the company spent$114.8 million to repurchase 1.3 million shares under the existing share-buyback program. As of Nov 30, 2019, it had $1.67 billion remaining under its share-repurchase authorization.
Zacks Rank & Stocks to Consider
CarMax currently carries Zacks Rank #3 (Hold).
Some better-ranked stocks in the Auto-Tires-Trucks sector include Weichai Power Co. (OTC:WEICY) , Spartan Motors, Inc. (NASDAQ:SPAR) and SPX Corporation (NYSE:SPXC) . While Weichai Power flaunts a Zacks Rank #1 (Strong Buy), Spartan Motors and SPX carry a Zacks Rank of 2 (Buy), at present. You can see the complete list of today’s Zacks #1 Rank (Strong Buy) stocks here.
Weichai Power has a projected earnings growth rate of 6.11% for the current year. Its shares have gained 86% over the past year.
Spartan Motors has an estimated earnings growth rate of 85.42% for the ongoing year. The company’s shares have surged 144.4% in a year’s time.
SPX has an expected earnings growth rate of 23.18% for 2019. The stock has appreciated 93.7% in the past year.
More Stock News: This Is Bigger than the iPhone!
It could become the mother of all technological revolutions. Apple (NASDAQ:AAPL) sold a mere 1 billion iPhones in 10 years but a new breakthrough is expected to generate more than 27 billion devices in just 3 years, creating a $1.7 trillion market.
Zacks has just released a Special Report that spotlights this fast-emerging phenomenon and 6 tickers for taking advantage of it. If you don't buy now, you may kick yourself in 2020.
Click here for the 6 trades >>
CarMax, Inc. (KMX): Free Stock Analysis Report
Spartan Motors, Inc. (SPAR): Free Stock Analysis Report
SPX Corporation (SPXC): Free Stock Analysis Report
Weichai Power Co. (WEICY): Free Stock Analysis Report
Original post
Zacks Investment Research