
CarMax Inc. (NYSE:KMX) reported better-than expected results in second-quarter fiscal 2020 (ended Aug 31, 2019), wherein earnings and revenues surpassed estimates. The specialty retailer of used and new vehicles posted net earnings per share of $1.40, beating the Zacks Consensus Estimate of $1.33. The bottom line also compared favorably with a profit of $1.24 per share reported in the year-ago quarter.
Notably, higher-than-expected revenues across all its segments led to the outperformance. Precisely, sales in the used-vehicle segment — which contribute to bulk of CarMax’s revenues — came in at $4,346.3 million, surpassing the consensus estimate of $4,300 million. Wholesale vehicle revenues of $678.3 million also surpassed the consensus mark of $634 million.
Net sales and operating revenues in the reported quarter increased 9.1% year over year to $5,201 million. The top line beat the Zacks Consensus Estimate of $5,026 million. Total gross profit rose 6.1% year over year to $693.5 million.
In second-quarter fiscal 2020, CarMax opened three stores: two in existing markets — San Francisco and Phoenix, and one in a new market— Lubbock.
CarMax, Inc. Price, Consensus and EPS Surprise
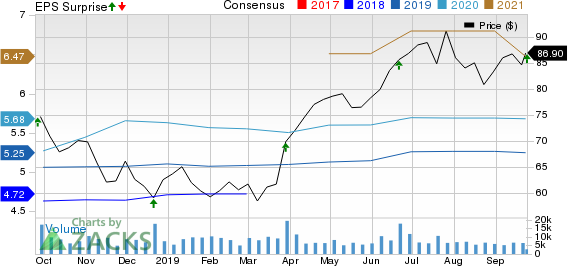
CarMax, Inc. price-consensus-eps-surprise-chart | CarMax, Inc. Quote
Segmental Performance
In second-quarter fiscal 2020, CarMax’s used-vehicle sales rose 9.3% from the prior-year period to $4,346.3 million on the back of higher unit sales and improved average selling price. The units sold also increased 6.2% year over year to 209,091 vehicles. The average selling price of used vehicles increased 2.9% from the year-ago quarter to $20,581. Used vehicle gross profit per unit came in at $2,183 versus $2,179 in the year-ago period. Comparable store used-vehicle units and revenues sold rose 3.2% and 6.3%, respectively, from the prior-year level. This robust performance reflects improved conversion and solid growth in web traffic.
Wholesale vehicle revenues rose 8% from a year ago to $678.3 million in the reported quarter. Units sold also increased 4.7% year over year to 126,513 vehicles, courtesy of growth in store base and appraisal buy rate. Moreover, the average selling price of wholesale vehicles rose 2.7% from the prior-year quarter to $5,090.Wholesale vehicle gross profit per unit came in at $928versus $919 in the year-ago period.
Other sales and revenues increased 9.1% year over year to $176.6 million. Moreover, the extended protection plan’s revenues rose 15% from the year-ago level.
CarMax Auto Finance reported a 4% year-over-year increase in income to $114.1 million in the quarter under review, reflecting collective effects of 7.8% rise in average managed receivables, partly offset by a decline in total interest margin percentage.
Costs, Financials and Share Buyback
Selling, general and administrative expenses increased 6.0% from the prior-year quarter to $480.8 million. Store openings and spending to boost the firm’s technology, along withomni-channel strategic initiatives led to the rise in SG&A costs.
CarMax had cash and cash equivalents of $40.7 million as of Aug 31, 2019, up from $37.1 million in the corresponding period of 2018. Long-term debt (excluding current position) amounted $1,689.1, reflecting an increase from $1,328 million in the year-ago comparable period. Its debt-to-capital ratio stands at 32%.
In the quarter under review, the company spent $128.3 million to repurchase 1.5 million shares under the existing share buyback program. As of Aug 31, 2019, it had $1.78 billion remaining under its share repurchase authorization.
Zacks Rank & Stocks to Consider
CarMax currently carries Zacks Rank #3 (Hold).
Some better-ranked stocks in the Auto-Tires-Trucks sector are Lithia Motors (NYSE:LAD) , Douglas Dynamics, Inc. (NYSE:PLOW) and SPX Corp. (NYSE:SPXC) . While Lithia Motors currently sports a Zacks Rank #1 (Strong Buy), Douglas Dynamics and SPX carry a Zacks Rank of 2 (Buy). You can see the complete list of today’s Zacks #1 Rank stocks here.
Lithia Motors has an expected earnings growth rate of 12.8% for 2019. The company’s shares have gained 71.6% year to date.
Douglas Dynamics has an expected earnings growth rate of 11.7% for 2019. The company’s shares have risen 24.7% year to date.
SPX has an estimated earnings growth rate of 22.7% for the current year. Its shares have gained 44.2% year to date.
Today's Best Stocks from Zacks
Would you like to see the updated picks from our best market-beating strategies? From 2017 through 2018, while the S&P 500 gained +15.8%, five of our screens returned +38.0%, +61.3%, +61.6%, +68.1%, and +98.3%.
This outperformance has not just been a recent phenomenon. From 2000 – 2018, while the S&P averaged +4.8% per year, our top strategies averaged up to +56.2% per year.
See their latest picks free >>
CarMax, Inc. (KMX): Free Stock Analysis Report
Lithia Motors, Inc. (LAD): Free Stock Analysis Report
Douglas Dynamics, Inc. (PLOW): Free Stock Analysis Report
SPX Corporation (SPXC): Free Stock Analysis Report
Original post
Zacks Investment Research