The U.S. dollar continued to extend it’s weakness, giving way to most of the currencies which are posting further gains. The euro rose above 1.20 handle and remains strong above this level. Gold prices also posted impressive gains as price rallied to $1320 an ounce on Tuesday.
On the economic front, the markets were relatively quiet. The UK's manufacturing PMI eased to 56.3 but the decline in the index did not impact the British pound much. The currency maintained gains on the back of a weaker USD. In the Eurozone, the final manufacturing PMI was in line with estimates at 60.6.
Looking ahead, the UK's construction PMI data is expected to be released today. Economists forecast a slowdown in the construction activity with the PMI likely to show a reading of 52.8. In the U.S. the ISM's manufacturing PMI data will also be released with estimates showing a reading of 58.1. Wrapping up the day, the FOMC meeting minutes will be coming out later in the evening.
EUR/USD intra-day analysis

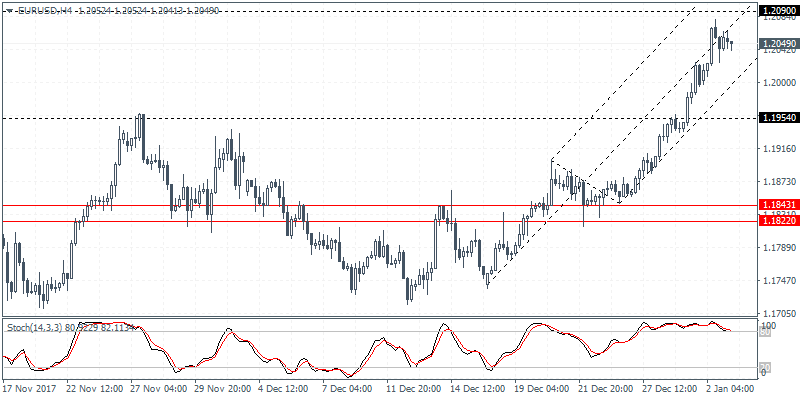
EUR/USD (1.2049):The EUR/USD continued to edge higher as price advanced to a fresh 4-month high at 1.2090 before easing back. The euro is now within reach of 1.2090 resistance which could be tested in the short term. Further gains can be seen coming on a close above this level. To the downside, the declines could be limited to 1.1954 level where support is most likely to be established. This could also become the new range for EURUSD in the short term. Watch for a potential exhaustion to the upside momentum in the short term for a possible correction.Unless we see a strong breakout that will justify further gains.
USD/JPY intra-dayanalysis

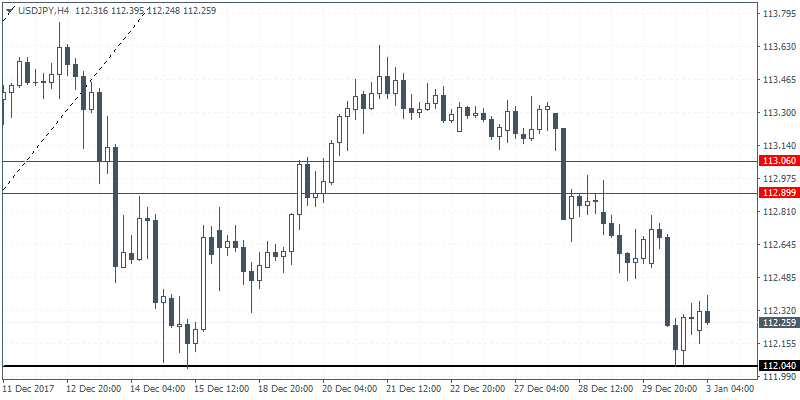
USD/JPY (112.25):The USD/JPY extended declines for a third consecutive daily session. The lower high formed on the daily chart and the subsequent declines suggest that the downside momentum could push USD/JPY towards the 110.70 level of support. Price action remains largely in a consolidation mode within the range of 114.00 - 110.70 region. On the 4-hour chart USD/JPY was seen bouncing off the short term support near 112.04. The short term gains could be limited however. In the event that the support at 112.04 breaks, further declines could see USD/JPY extending towards the next lower support near 111.61 - 111.57 area.
NZD/USD intra-day Analysis

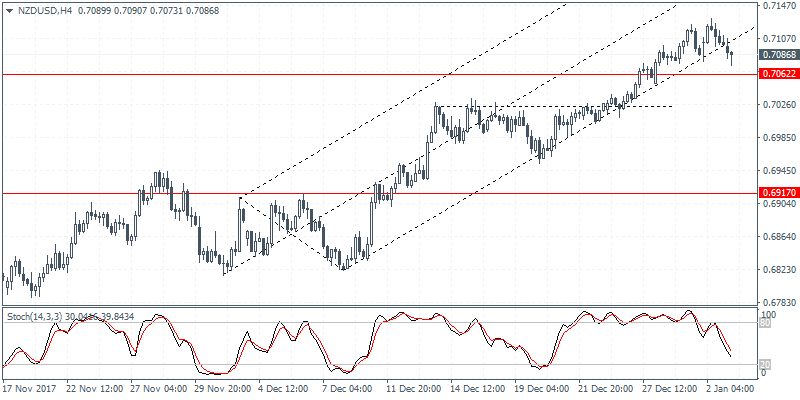
NZD/USD (0.7066):The New Zealand dollar is showing signs of exhaustion to the rally following the previous two day's doji close. A bearish close today could indicate a near term correction in price. Support at 0.7062 remains a key level for the currency pair. A break down below this level could see the correction extending lower to 0.6917. To the upside, if the support holds, NZD/USD is likely to extend the gains to the next resistance level found at 0.7160.
