It has been almost two months since I last provided an update on Tesla (NASDAQ:TSLA) stock. See my article here.
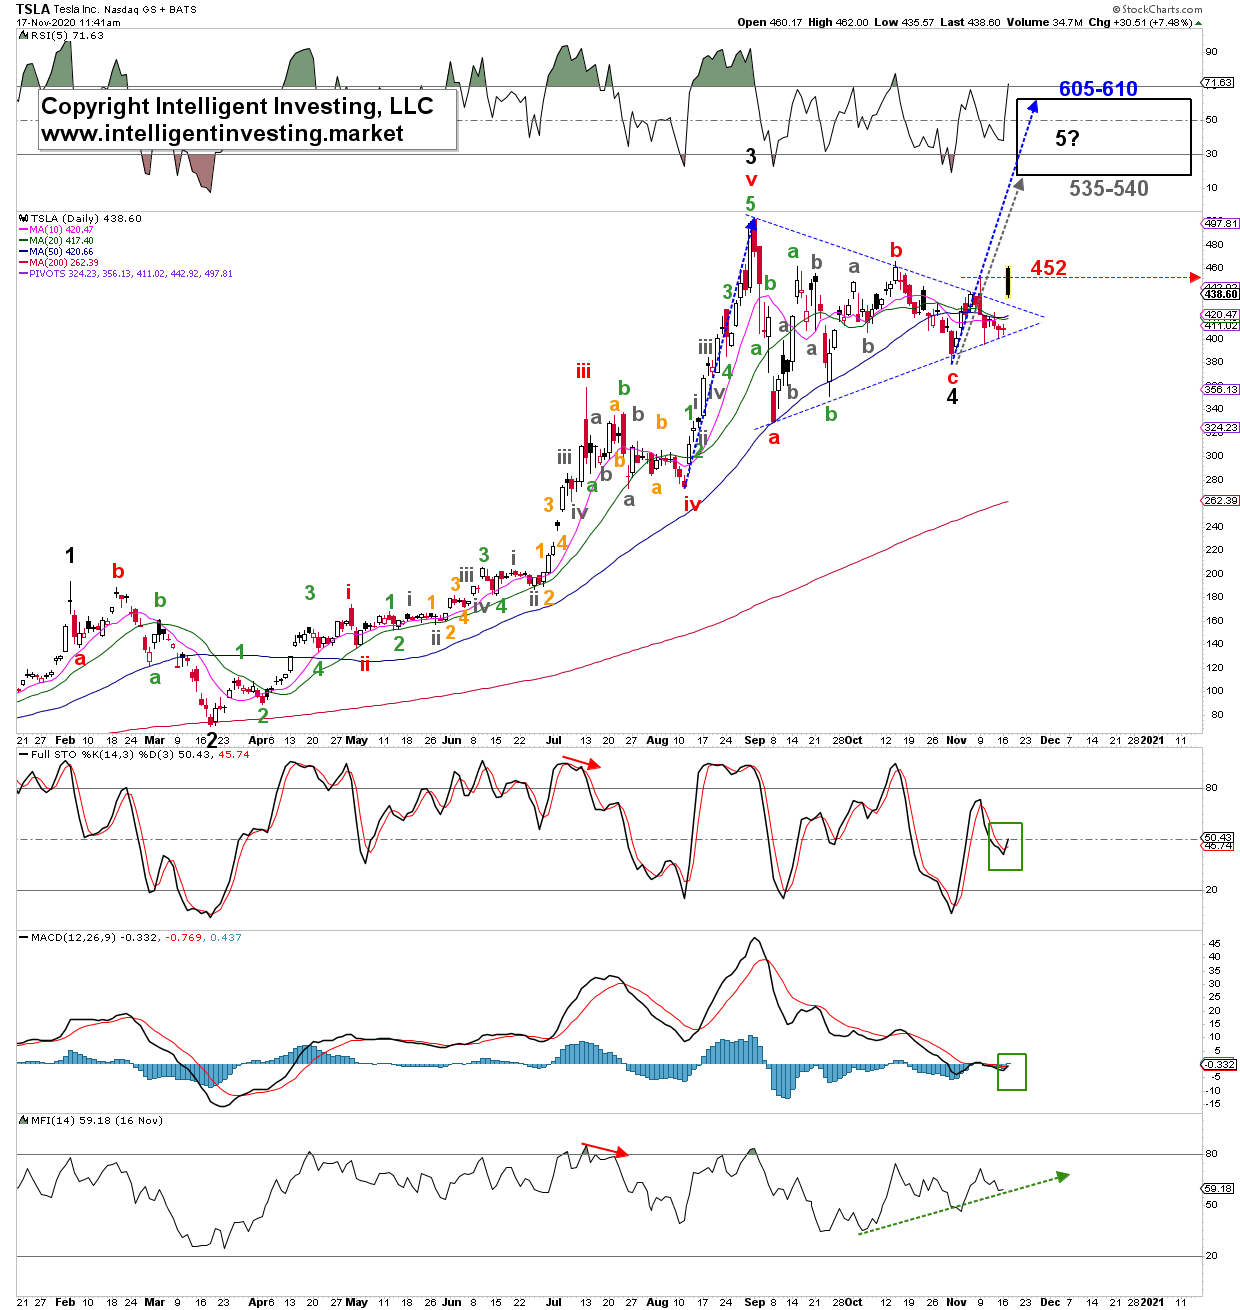
Back then I was bearish on Tesla. It dropped another 10% at the low the next day, but stalled at $391, not the low $300s I was looking for. Why? Because it appears Tesla was forming a triangular-shaped correction. When I wrote the update, I could not know this was forming, because as said several times “Corrections are always the trickiest to forecast as they can take on many forms.” See figure 1 below.
Figure 1:

Well, now we have our form: a triangle. See here for a basic explanation of the EWP triangle correction. Today, Tesla broke out of that triangle. If it can hold above the upper blue dotted downtrend line that has held all upside in check since the stock topped early-September, I expect it to move higher in a wave-5 to ideally $535-540, grey arrow where wave 5=1, but possibly as high as $605-610 based on simple symmetry breakout (blue arrows) of a classic bull flag.
The technical indicators (RSI5, MACD, FSTO, Money Flow Index) are all starting to point back up and give buy signals. In addition, so far today’s move higher launches price back above its 10-, 20-, and 50-day Simple Moving Averages (SMAs), while it has been all along above its rising 200d SMA. Thus, the last two months must still be considered a correction within a larger uptrend.
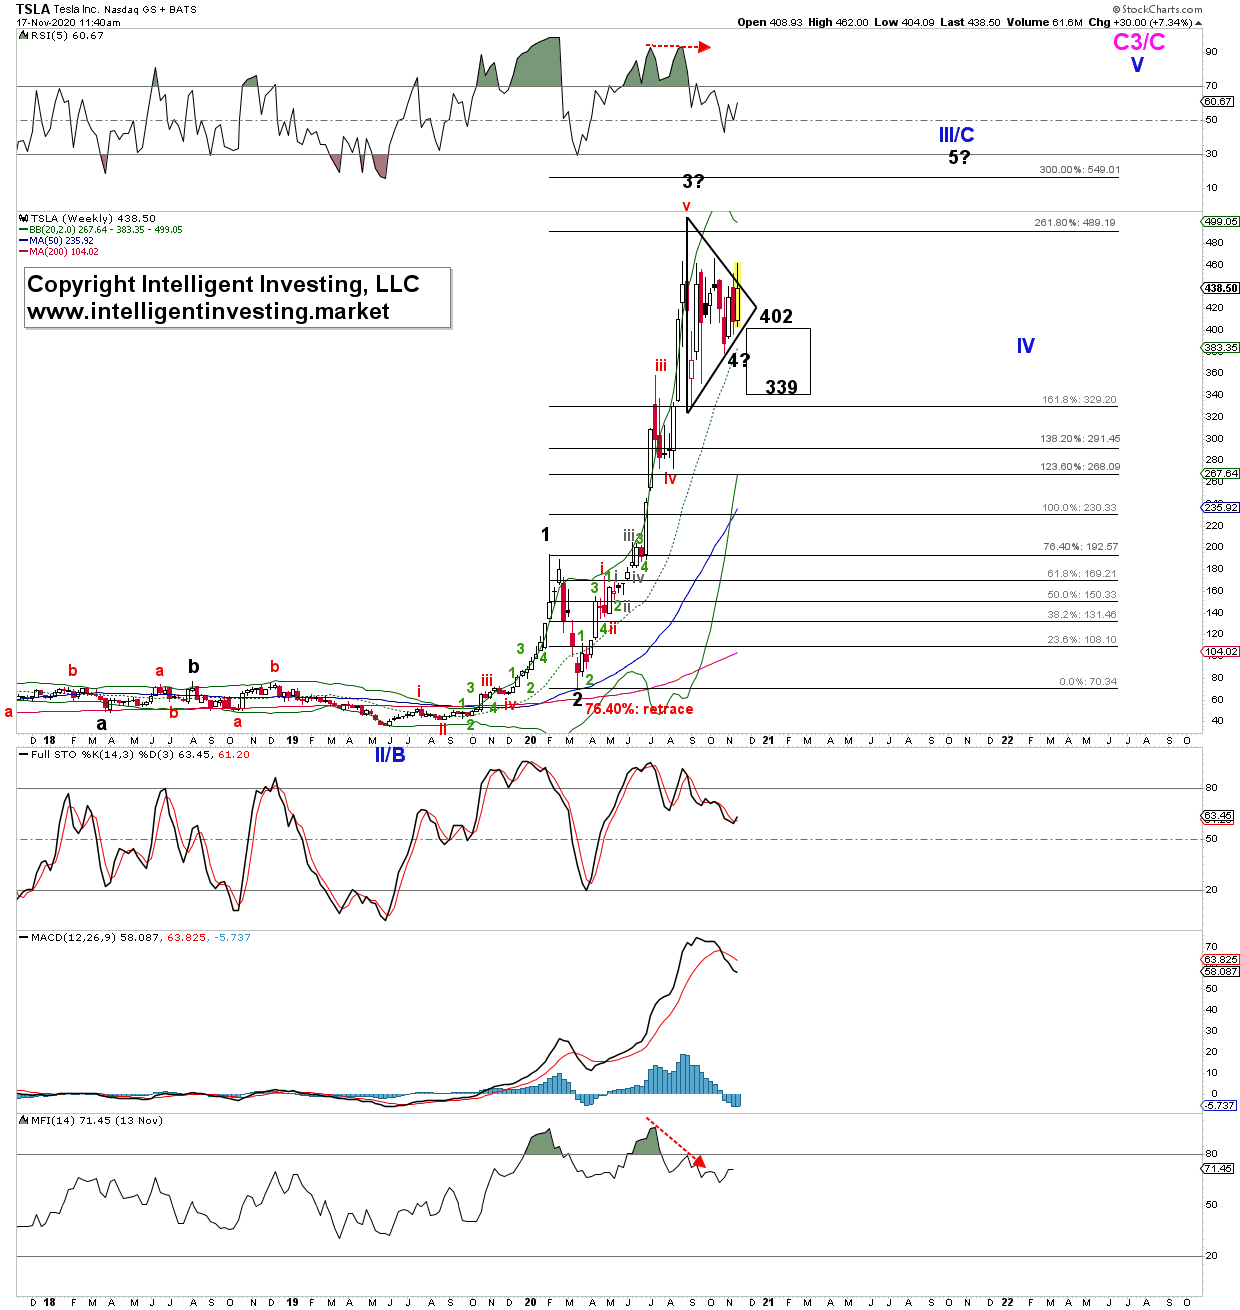
Zooming out to the weekly timeframe, see Figure 2 below, I find (black) major wave-3 topped around the 216.80% extension of wave-1, measured from wave-2: $502 vs $490. Since that high, wave-4 has stalled within the 23.60-38.20% retrace zone, typical for a 4th wave. It is now trying to breakout of the triangular pattern. A weekly close featuring a breakout would of course add weight to the evidence
Figure 2:

Bottom line: if Tesla can hold at least $428, and from an EWP-perspective $380 ultimately, it has completed a larger 4th wave as a (tricky) triangle and can now move higher to ideally $535-550, possibly as high as the low $600s to complete wave-5 of larger wave-III/C. From those levels an even larger correction than the recent one should be expected. We will deal with it when we get there, let's first nail this breakout and ride the next leg higher as I alerted my private twitter trading feed members to.
Note: I did not mention the reason why Tesla is supposedly rallying. I.e. the “news” it will be included in the S&P 500 next month. The why is not important for trading. One does not need to know the why to make trading decisions. What only matters are – in this case – Tesla is moving higher to certain mathematically calculated price-levels (target) and in order to get there it should not break below certain price levels (stop). That is the actionable take-away and all we really need to know.
