Get 40% Off
👀 👁 🧿 All eyes on Biogen, up +4,56% after posting earnings. Our AI picked it in March 2024.
Which stocks will surge next?
Unlock AI-picked Stocks

Can Nasdaq 100 Go As Low As 10500?

Published 10/28/2020, 03:23 PM
Updated 07/09/2023, 06:31 AM

Two weeks ago, I concluded in my latest article about the Nasdaq 100:

“[The Elliott Wave Principle (EWP)] tells me the index has now reached an inflection point. Either complete a larger impulse to possibly, and ideally, as high as 13080, or only complete a countertrend rally to around current levels, possibly as high as 12730. I am personally still long (1/3 TQQQ position left) the index and have moved stops up to lock in remaining profits on any move lower, but to also remain exposed in case the index moves higher.”

Fast forward, and the index had topped at those “around current levels” that same day, for what is now labelled as a countertrend rally (red) b-wave. Yes, the market had all the potential to complete a five-wave impulse, but instead morphed into only a three-wave bounce. This is the best example of how markets work: it is all about the probabilities of possibilities. The market always has several options at any given point in time as it is dynamic, stochastic and probabilistic in nature. I personally, thus, got stopped out of my remaining 1/3 TQQQ position and locked in my hard-earned profits. That is how it is done.
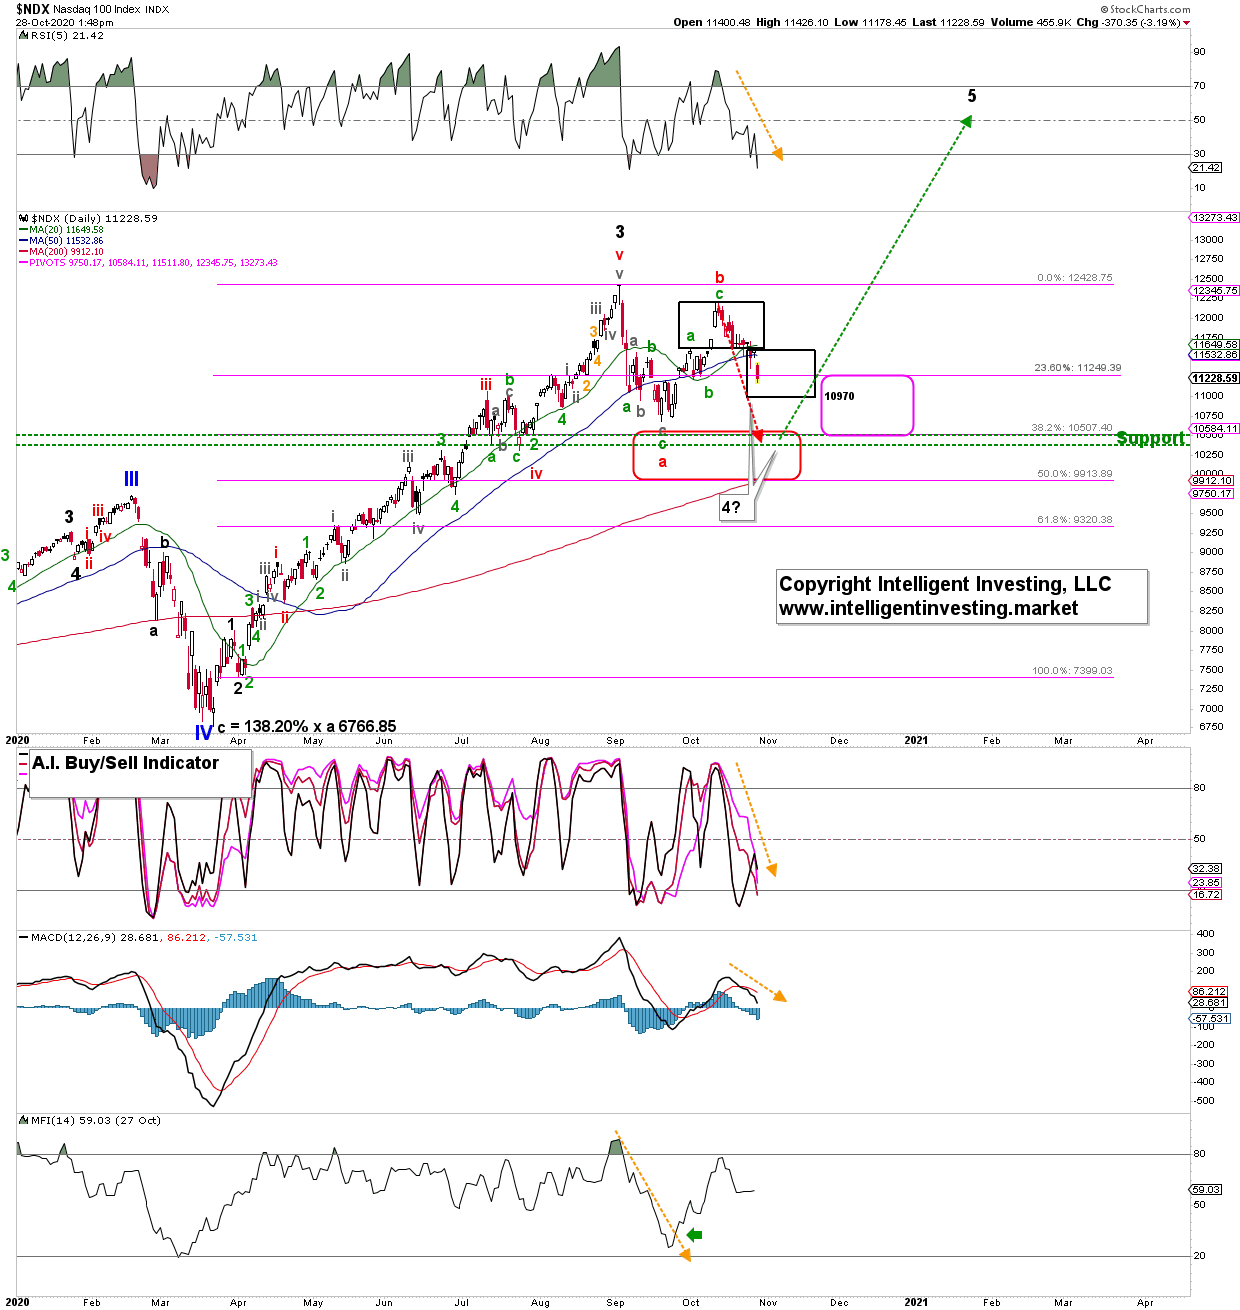
Nasdaq 100 Daily Candlestick Chart With EWP Count.

In a normal flat, wave-c = wave-a (red dotted arrow), which could target as low as 10400. Flat corrections can also have truncated c-waves or even extended c-waves. It is, at this stage, impossible to know which it will be, so I must, logically, go by the regular flat until proven otherwise. In that case, the index will once again reach my ideal (red) wave-4 target zone. Besides, 4th waves normally retrace between 23.60 to 38.20% of the prior 3rd wave (purple box) and the latter sits at 10507. Thus, as already said two weeks ago, we should expect the NDX to reach 10500+/-100.

3rd party Ad. Not an offer or recommendation by Investing.com. See disclosure here or remove ads .

In the case of a truncated flat, expect the NDX to ideally stall around 10950+/-20, which is the lower end of symmetry breakdown based on the two black boxes. In the case of an expanded flat, expect the NDX to reach as low as 10150+/-50.

Bottom line

The NDX failed to complete the potential impulse path it was on since the September low, and morphed into only a three-wave bounce that completed on Oct. 12. Based on the EWP rules and price patterns, the current breakdown is, therefore, most likely a c-wave of a flat 4th wave down to, ideally, NDX 10500+/-100. The index has the option to stall at around 10970, but for now that is not preferred. Once these price levels are reached in the coming days, it is time to prepare for the next larger multi-month 5th wave rally to new all-time highs.

So, with three waves down into the September low and then a three-wave advance into the Oct. 12 high, which retraced around 90% of that down move, followed by a bearish break below 11590 initially, and below the 20 and 50 day simple moving averages this week, we are most likely dealing with a flat correction in EWP-terms as I already mentioned it could morph into two weeks ago:

However, if the index breaks below 11590 from current levels, then that is a serious warning to the bulls. In that case, black wave-4 is most likely not complete, and we should see a revisit of the critical 10500 +/-100 level again. If that happens, the recent rally was a larger b-wave of what is called – in Elliott Wave terms – a flat correction for wave-4. Please see my website, https://intelligentinvesting.market/elliott-wave-theory/ for more information about what a flat correction exactly is.

3rd party Ad. Not an offer or recommendation by Investing.com. See disclosure here or remove ads .

Therefore, I had my stops in place: successful trading thanks to the EWP.

Figure 1. NDX100 daily candlestick chart with EWP count.

Latest comments

Thank you. This is exciting!
... yes . in about 5 minutes. in fact 10k tomorrow..  8k next week  ..,.,
I dont think so. where would all that money go. Only stocks give profit. It goes back fast and even more.
Treasury bonds will hedge stocks.
I guess this only means there will be more selling opputinities at the US open thsn buying right?
corrections are buying opportunities.
Chart says, “buy low / sell high, learn dollar cost averaging, & leveraged equities will burn you if we reclose the world”. Dr. BiG DaDDy has spoken
DCA in 2000 and ending in 2002 maybe right? A bloodbath!
Does this mean that tomorrow NAS is going to sell to 10500??
read the chart my friend, not tomorrow, soon
No, there’s no time aspect in this analyses. But as Gabriel Alin said: soon. In the next few trading days/week most likely.
My guess would be right shoulder forms going into election whoch will be a mess and trigger a large sell offI locked in some profits today but am letting some run for a bounce into tech earnings tommorrow..Painful to take 40k hit in one day though
that would be perfect to fill in the September 25th Gap as the Dow and S&P have already filled in their gaps
thank you! agree!
Risk Disclosure: Trading in financial instruments and/or cryptocurrencies involves high risks including the risk of losing some, or all, of your investment amount, and may not be suitable for all investors. Prices of cryptocurrencies are extremely volatile and may be affected by external factors such as financial, regulatory or political events. Trading on margin increases the financial risks.
Before deciding to trade in financial instrument or cryptocurrencies you should be fully informed of the risks and costs associated with trading the financial markets, carefully consider your investment objectives, level of experience, and risk appetite, and seek professional advice where needed.
Fusion Media would like to remind you that the data contained in this website is not necessarily real-time nor accurate. The data and prices on the website are not necessarily provided by any market or exchange, but may be provided by market makers, and so prices may not be accurate and may differ from the actual price at any given market, meaning prices are indicative and not appropriate for trading purposes. Fusion Media and any provider of the data contained in this website will not accept liability for any loss or damage as a result of your trading, or your reliance on the information contained within this website.
It is prohibited to use, store, reproduce, display, modify, transmit or distribute the data contained in this website without the explicit prior written permission of Fusion Media and/or the data provider. All intellectual property rights are reserved by the providers and/or the exchange providing the data contained in this website.
Fusion Media may be compensated by the advertisers that appear on the website, based on your interaction with the advertisements or advertisers.
© 2007-2024 - Fusion Media Limited. All Rights Reserved.