
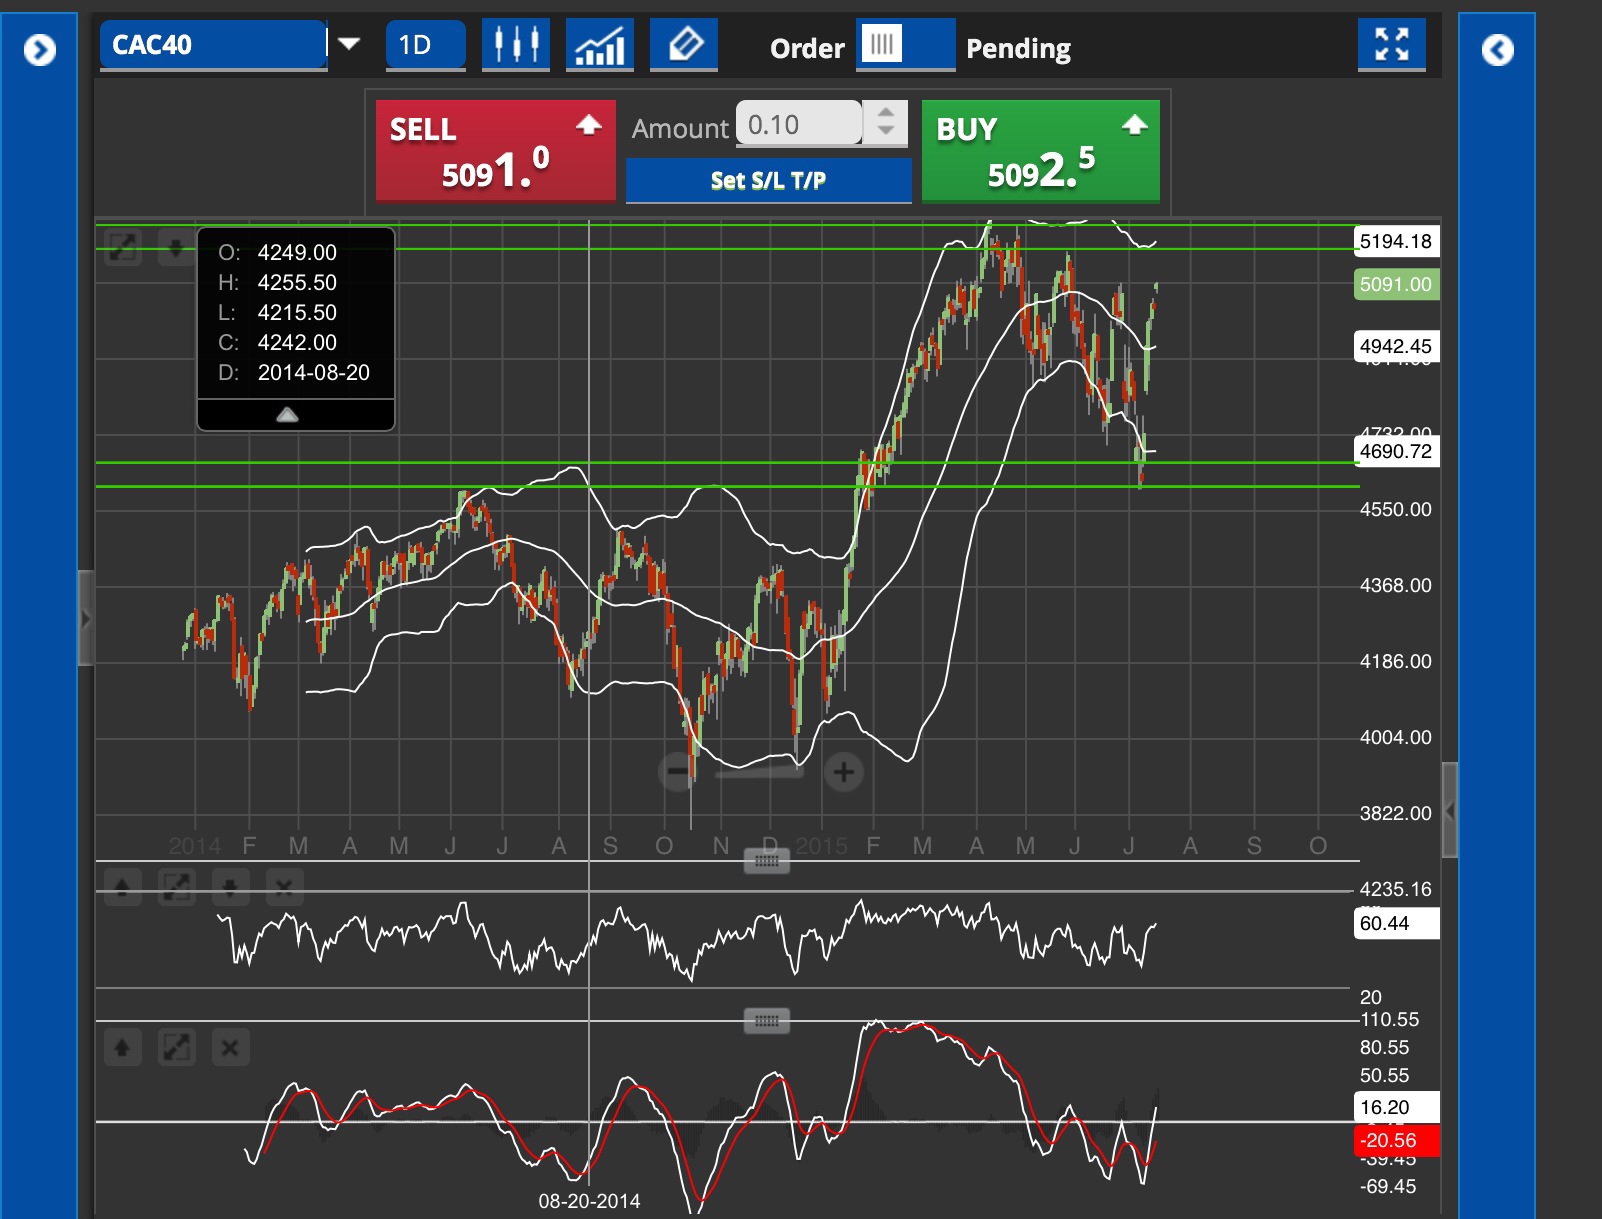
The CAC 40 index is trading above its upward trend line on a daily time frame. The price has also broken its downward trend line if we draw this by connecting the lower lows near the right hand corner. The volatility of the index is relatively lower on this time frame as it is trading within the bollinger band. Having said that, the price has been falling higher in the direction of current upward trend.
The RSI indicator is trading in line with the price action which translates that while the price is making the higher high, the momentum indicator is also confirming the same. The MACD indicator which has been trading in an oversold region for some time has also bounced back up and it is also trading inline with the price action.
Important zones
4607- 4669 Support
5182- 5230 Resistance
Disclosure & Disclaimer: The above is for informational purposes only and NOT to be construed as specific trading advice. responsibility for trade decisions is solely with the reader.
by Naeem Aslam