When selling cash-secured puts our position management skills include buying back the short puts under certain circumstances. These include situations when share price moves up or down dramatically. When share price declines below the breakeven, we start losing money. Our guideline is to buy back the sold put if share price declines by more than 3% below the strike. This article will focus in on scenarios when stock price gaps up. We will use Broadcom Limited (NASDAQ:AVGO), a stock frequently on our Premium Watch List.
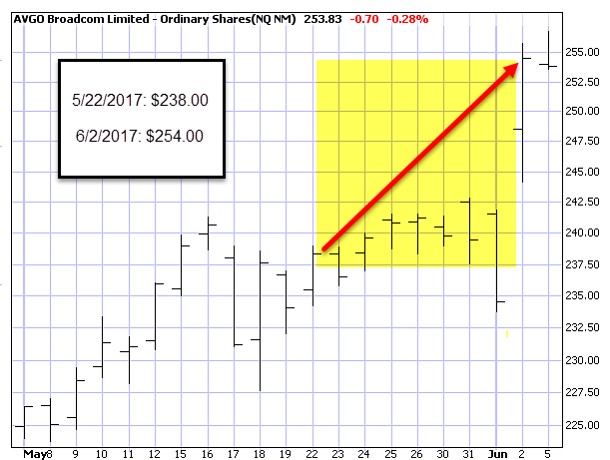
AVGO from 5/22/2017 to 6/2/2017

On 5/22/2017 AVGO (Broadcom Limited) was trading at $238.00 and then gapped up to $254.00 on 6/2/2017.
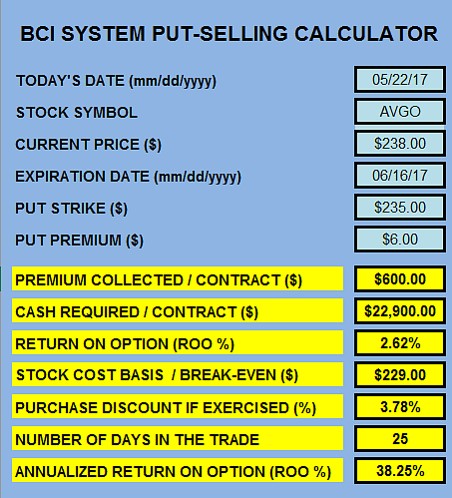
Selling the $235.00 out-of-the-money put on 5/22/2017

AVGO: Put Calculations
The BCI Put Calculator shows us that we generate an initial 25-day return of 2.62% (38.25% annualized). The cash required to secure this put is $22,900.00 per contract
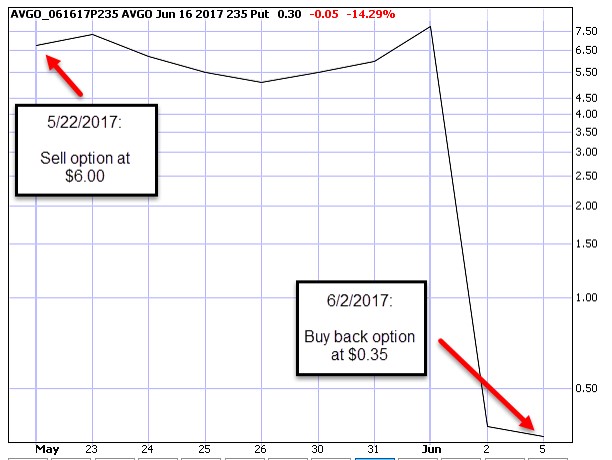
Charting the $235.00 put option from 5/22/2017 through 6/2/2017

Guidelines to buy back put options after stock price gap-up
We automatically buy back the short put when the premium value declines to 20% or less of the original sale price in the first half of the contract and 10% or less in the second half of the contract. In the case of AVGO, the decline was about 6% of the original option sale price of $6.00.
Benefit of closing
The reason it usually makes sense to close in this situation is because we now free up the $22,900.00 per contract which can be used to secure another put position in the same contract month. If we can generate more than $35.00 per contract, this will enhance our portfolio returns.
Market tone
Global stocks rose this week, with the MSCI All Country World Index hitting a record high. West Texas Intermediate crude oil slipped to $49.50 a barrel from $51.50 last Friday. Volatility, as measured by the Chicago Board Options Exchange Volatility Index (VIX), closed at a record on Thursday and traded at 9.65. This week’s economic and international news of importance:
- Hurricanes Harvey and Irma combined to bring an end to a seven-year streak of positive US payroll reports. Thirty-three thousand jobs were lost
- The unemployment rate dipped to 4.2% due to a temporarily smaller labor force
- Average hourly earnings rose to an annual rate of 2.9
- An unexpected positive effect of the hurricanes was a spike in September auto sales as consumers replaced vehicles damaged in the storms.
- Catalonia, the wealthy Spanish region that is home to Barcelona, is expected to declare independence from Spain next week
- Figures from the United States, Europe and China released this week all showed continued solid economic growth
- September figures for the US manufacturing and services sectors both showed their strongest readings in more than a decade, but the US data may have been somewhat distorted by the recent hurricanes
- The Institute for Supply Management manufacturing index rose to 60.8, the highest level since September 2004, while the non-manufacturing reading came in at 59.8, a level not seen since August 2005
- European data were similarly robust, and China also showed continued upward
- President Trump is expected next week to decertify that the Iran nuclear deal — designed to restrain Iran’s nuclear. If the president withholds certification, Congress then has 60 days to decide whether to re-impose sanctions on Iran
- The US House of Representatives took the first step toward passing a tax overhaul by approving a fiscal- year 2018 budget blueprint. Passage of the House measure ups the odds that tax reform could be enacted early in 2018
THE WEEK AHEAD
Mon Oct 9th
- Bond market closed
Tue Oct 10th
Wed Oct 11th
- FOMC minutes
Thu Oct 12th
- Eurozone: Industrial production
Fri Oct 13th
- China: Trade balance
- US: Trade balance
- US: Consumer price index
For the week, the S&P 500 rose by 1.19% for a year-to-date return of 13.87%
Summary
IBD: Market in confirmed uptrend
GMI: 6/6- Buy signal since market close of August 31, 2017
BCI: I am currently favoring in-the-money strikes 2-to-1.
WHAT THE BROAD MARKET INDICATORS (S&P 500 AND VIX) ARE TELLING US
The 6-month charts point to a slightly bullish outlook. In the past six months, the S&P 500 was up 10% while the CBOE Volatility Index (9.65) moved down by 30%.
Much success to all,
