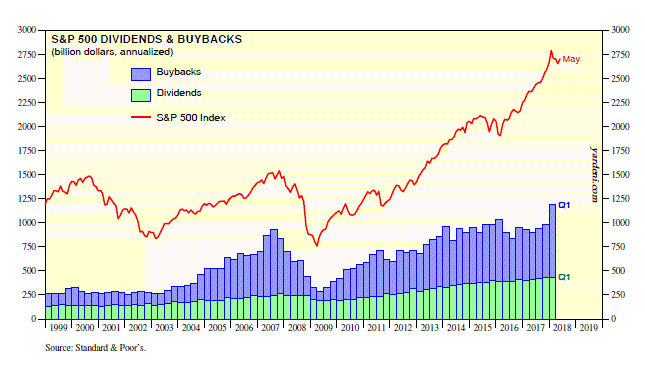
S&P 500 buybacks are back. Actually, they never left the current bull market despite recurring chatter that the buyback binge was over. Since 2014, they’ve fluctuated around an annualized rate of roughly $550 billion. They jumped during Q1-2018 to an annualized $756 billion. That’s a record high, exceeding the previous record high of $688 billion during Q3-2007.
Obviously, buyback activity was boosted by repatriated earnings following the passage of the Tax Cuts and Jobs Act at the end of last year. It lowered the corporate tax rate on such earnings from the 35.0% statutory rate to a one-time mandatory tax of 15.5% for liquid assets and 8.0% for illiquid assets payable over eight years. Odds are that corporations will continue to buy back their shares at a solid pace through the end of this year, though not at the record set during Q1.
I’ve often argued during the current bull market that the Fed’s Stock Valuation Model makes more sense to explain corporate buyback decisions than it does to explain investors’ stocks-vs-bonds asset allocation decisions. As I explain in Chapter 14 of Predicting the Markets:
“[C]orporate finance managers have a big incentive to buy back their companies’ shares when the forward earnings of their corporations exceeds the after-tax cost of borrowing funds in the bond market. Using the pretax corporate bond yield composite overstates the after-tax cost of money borrowed in the bond market. The spread between the forward earnings yield and the pretax cost of funds did widen after 2004 and remained wide well into the next decade. Obviously, it did the same on an after-tax basis. … The bottom line is that as corporate managers have increased their buyback activities, their version of the Fed’s Model has probably had more weight in the valuation of stocks. In theory, this means that valuation should be determined by the corporate version of the model.”
Meanwhile, S&P 500 dividends set a record high of $436 billion (annualized) during Q4-2017 and remained there during Q1 of this year. Together, trailing four-quarter buybacks and dividends jumped to $1.0 trillion during Q1. Since the start of the bull market during Q1-2009, buybacks have totaled $4.1 trillion, while dividends totaled $2.8 trillion. The grand total has been $6.9 trillion, so far!
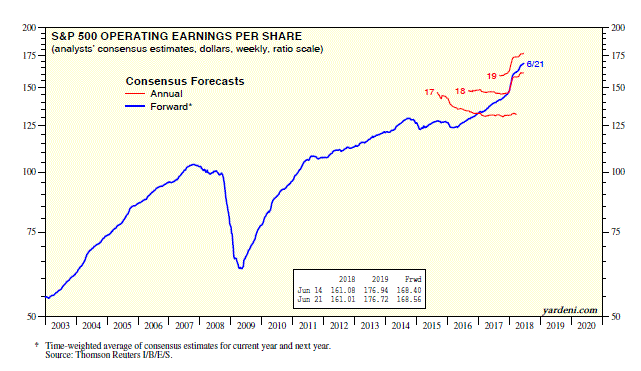
While the bull market stopped charging ahead ever since the 1/26 record high, it continues to zigzag in record-high territory. The bears can continue growling about a potential trade war. Meanwhile, the bulls are taking a break and grazing on share buybacks and record corporate earnings. S&P 500 forward earnings rose to $168.56 per share during the 6/21 week, rapidly approaching my $170 target for year-end. Barring a trade war, that number should easily be achieved. Now multiply it by forward P/Es of 14, 16, and 18 to get the year-end S&P 500 potential levels of 2390, 2720, or 3060. Take your pick. I pick 3100. Again, that’s barring a trade war.

