Enterprise data storage solutions provider Pure Storage (NYSE:PSTG) stock has rallied nearly 30% off its Q3 2020 lows fuel by takeover speculation in the cloud data storage provider segment. Management set the bar low heading into fiscal Q4 2020 results with “internal” revenue estimates that are not supposed to be construed as formal guidance. The softness in the most recent quarter was attributed to the small and medium-sized business (SMB) clients impacted by the pandemic. As the COVID-19 vaccine distribution accelerates, this segment should see an accelerated recovery especially with an abundance of new government stimulus expected. Prudent investors seeking a recovery play can monitor Pure Storage for opportunistic price pullback levels as shares trigger a reversion.
Q3 FY 2020 Earnings Release
On Nov. 24, 2020, Pure Storage released its fiscal third-quarter 2020 results for the quarter ending October 2020. The Company reported an earnings-per-share (EPS) profit of $0.01 excluding non-recurring items versus consensus analyst estimates for breakeven, a $0.01 beat. Revenues dropped (-4.1%) year-over-year (YoY) to $410.6 million beating analyst estimates for $406.44 million. Product revenue was down (-15.1%) YoY to $274.5 million. Subscription services revenues jumped 29% YoY to $136.1 million representing 33% of total revenues, up from 25% of total revenues YoY. While the Company cautioned the internal estimates for Q4 should not be taken as a formal guidance, Pure Storage expects a (-2%) YoY decline to $480 million, which is still higher than the consensus analyst estimates for $469 million.
Conference Call Takeaways
Pure Storage CEO, Charlie Giancarlo provided color on the quarter. He highlighted the transformation from a two product storage company to a full multi-cloud data services platform “increasing our relevance to both those who build infrastructure, that is IT, and those that build applications, namely developers and dev-ops.” The integration of recently acquired Portworx continues to run smoothly. He explained:
“Our strategy with Portworx is to continue their software-defined storage container and Kubernetes control roadmap and layer in Pure’s capabilities with VMs and bare-metal workloads, all managed through our unique SaaS-based Pure1 management system.”
Giancarlo made an insightful point:
“Customers are moving to services and suppliers that provide the outcomes they desire rather than just the means for customers to create those outcomes themselves… Portworx is just as comfortably deployed in the cloud as on-premises, supporting a new set of customers who are born in the cloud and may never consider on-prem infrastructure.”
The FlashBlade product, which consolidates and modernizes unstructured data across a number of uses, including technical computing, analytics and rapid recovery is seeing exceptional demand momentum. He pointed out some enterprise clients including, “First National Bankers Band, the Louisiana Office of Technology Services and Sinai Health Systems demonstrates that FlashBlade continues to be the leading choice to enable rapid recovery to defeat ransomware.”
Takeover Speculation
The unexpected surprise acquisition announcement of Slack Technologies (NYSE:WORK) by Salesforce (NYSE:CRM) on Dec. 1, 2020, triggered further takeover speculation in the work flow collaboration and cloud storage companies.
In addition to Pure Storage, shares of data storage peers Dropbox (NASDAQ:DBX) and Box (NYSE:BOX) jumped to new yearly highs. As rumors fade, prudent investors can monitor opportunistic pullback levels to consider scaling into a position.

PSTG Opportunistic Pullback Levels
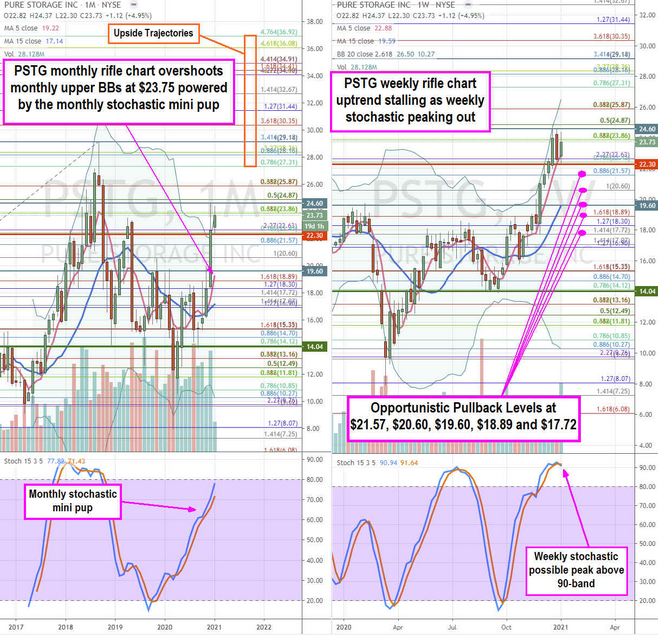
Using the rifle charts on the monthly and weekly time frames provide a broader view of the price action playing field for PSTG stock. The monthly rifle chart exploded to the upside overshooting its upper Bollinger Bands (BBs) at $23.75 as shares peaked near the $24.87 Fibonacci (fib) level. While shares make a reversion to the $22.43 fib, it also formed a weekly market structure high (MSH) trigger below $22.30 to challenge the earlier market structure low (MSL) buy trigger above $14.04 in April 2020. The weekly rifle chart shows a 5-period moving average (MA) support at $22.88 with a peaking weekly stochastic at the 90-band. From here, PSTG can trigger another spike towards the daily upper BBs above the $25.89 fib on the weekly stochastic cross up. If the weekly stochastic crosses down, then prudent investors can monitor opportunistic pullback levels at the $21.57 fib, $20.60 fib, $18.89 fib, $19.60 sticky 5’s level and the $17.72 fib. The upside trajectories range from the $27.31 fib to the $36.92 fib. Traders can also watch cloud storage as both stocks move together.
