Last week, we discussed the flare-up in the “trade war” rhetoric as the current Administration doubled down with China. To wit:
“On Monday, we woke to the “sound of distant drums” beating out the warning of a pending trade war as China vowed to retaliate to the $50 billion in tariffs imposed by the Administration on Friday. On Tuesday, U.S. futures plunged lower after President Trump called for $200 Billion more in Chinese tariffs and China vowed to ‘hit back.’”
Given all the rhetoric it was not surprising to see the market pullback this past week. However, sharply lower opens were repeatedly bought Dana Lyons as noted by :
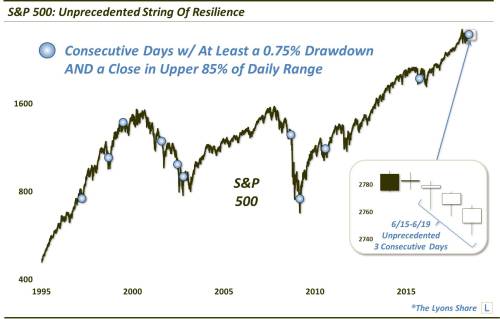
“As a matter of fact, in some ways, the bulls resilience over the past 3 days has been unprecedented. Consider this – in each of the 3 days from June 15-June 19, the S&P 500:
- Was down at least 0.75% at some point during the day and
- Rallied to close in the upper 85% of its daily range
How noteworthy is this 3-day feat? As the Chart Of The Day indicates, it is actually the first time the index has ever accomplished it in its nearly 70-year history.”
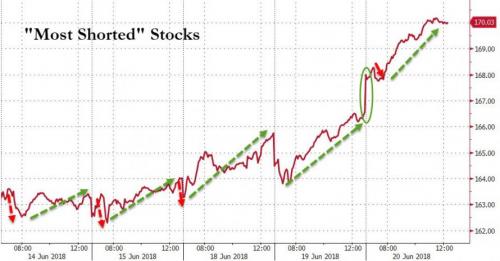
While it certainly seemed as if the “bulls are bulletproof,” it is worth noting that much of the action not only surrounded a few number of participants but also money was chasing the most shorted of stocks. As noted by Zerohedge:
“And it got even more squeezy today…”
Nonetheless, in the very short-term, bulls do remain in charge and our investment discipline requires us to “follow the action” regardless of how we “feel” about it. Currently, that action remains bullish, and we must look to modestly increase equity exposure as noted last week:
“More importantly, the market is sitting at the critical juncture of either a continuation of pathway #1 toward all-time highs, or a correction of some sort to retest support and confirm this past week’s breakout. A corrective retest that provides a better entry point to increase exposure is the most preferable of outcomes.”
That is what we got this past week as the market retested the most recent breakout above the Fibonacci 61.8% retracement level twice.
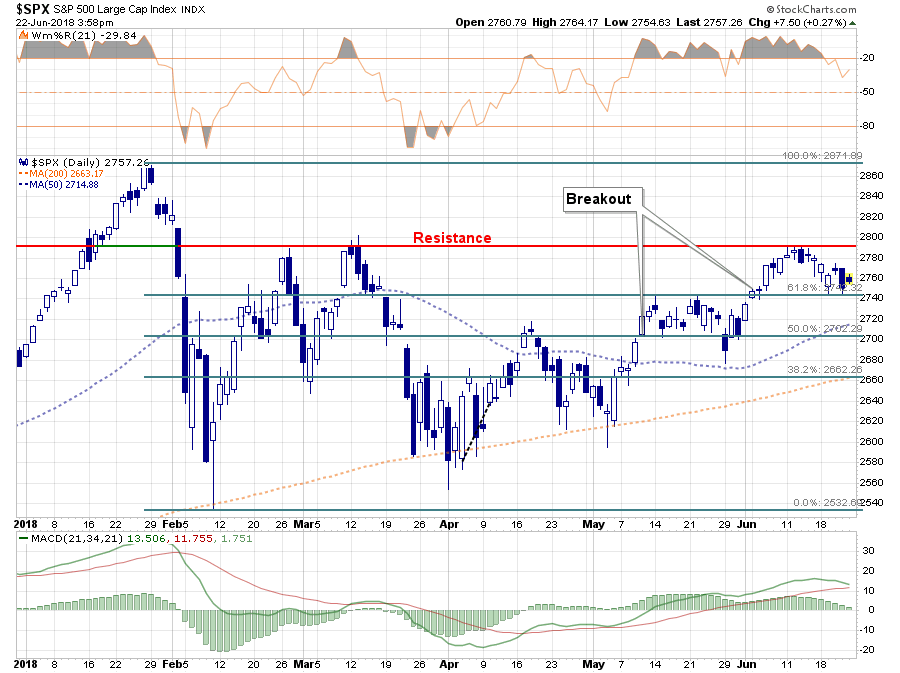
We went on to note:
“The market has continued to remain within its bullish trend channel from the 2015 lows which is why we only mildly reduced our overall equity exposure in February of this year. On a very short-term basis, the market is overbought so we will look for weakness next week to add further exposure to portfolios.”
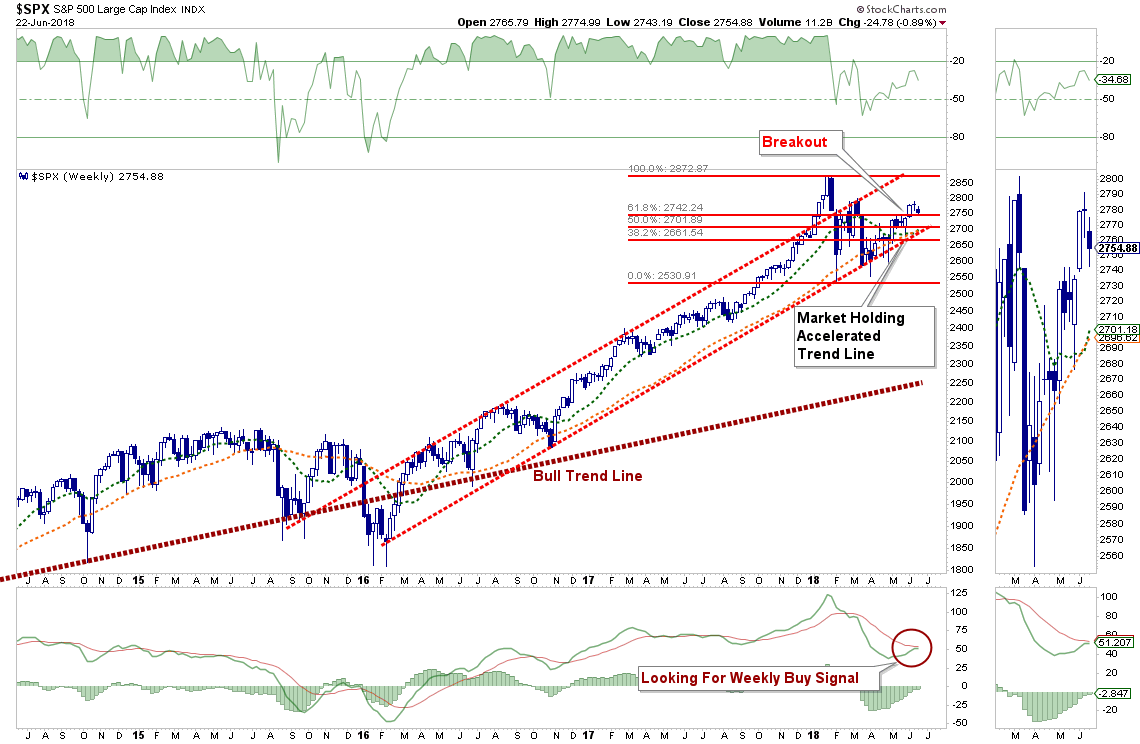
“This is particularly the case given the weekly ‘buy signal’ is close to triggering and any further market strength, or consolidation, will likely trigger that signal by the end of next week. In accordance with our discipline, such a trigger will require opportunistically increasing equity exposure back to target levels.”
While the weekly “buy signal” did NOT trigger this week, keeping our allocation model at 75%, we have been adding exposure over the last few weeks as the market continued to break out of consolidations. As we stated previously, we were looking for the following setup to add equity exposure to portfolios.
- A retracement back to previous support that did not violate it
- An oversold condition on a short-term basis.
- An opportunistic setup for a continuation of our investment pathway #2a
As shown in the chart below, all three requirements were fulfilled this week. Therefore, on Thursday and Friday, we did increase equity exposure and will look to add more on any weakness in the markets early next week.
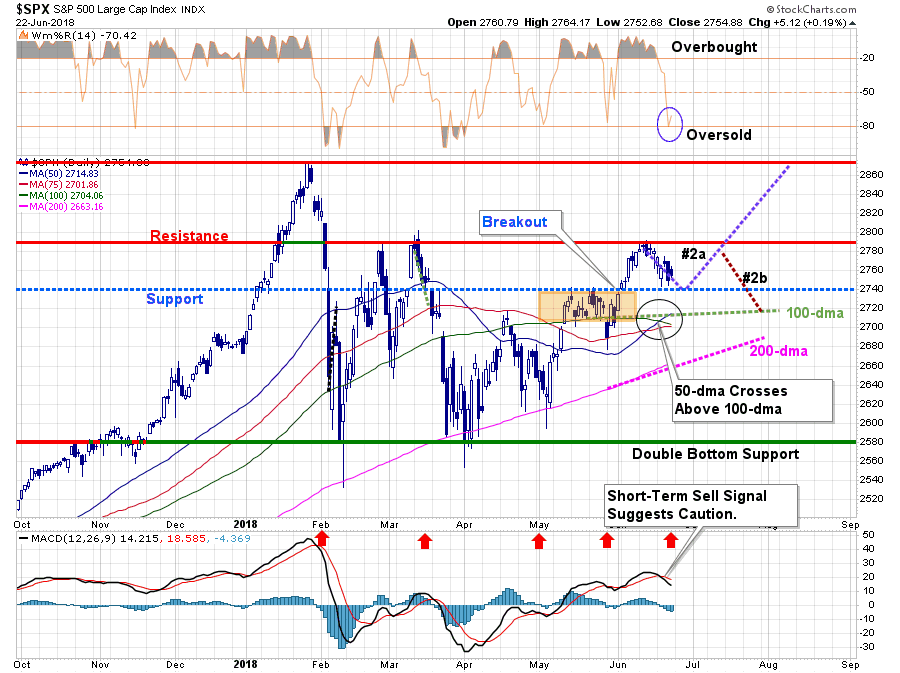
There is risk to the outlook, however. With the short-term sell signal triggered last week, it does keep us cautious. However, as we have seen previously, such a signal can be reversed quickly. Also, with the 50-dma crossing above 100-dma, further support for a continued bullish advance is back in place.
Importantly, while we are indeed more “bullishly inclined” at the moment, and are willing to give the bulls a bit of “running room,” we have moved stops up. We are also keeping our tolerance for losses restricted as downside risk continues to outweigh reward over the intermediate term.
We still remain slightly overweight in cash, and underweight equities, as the late-cycle risk and trade issues remain heavily prevalent. As noted on Tuesday:
“Wall Street is ignoring the impact of tariffs on the companies which comprise the stock market. Between May 1st and June 1st of this year, the estimated reported earnings for the S&P 500 have already started to be revised lower (so we can play the ‘beat the estimate game’). For the end of 2019, forward reported estimates have declined by roughly $6.00 per share.”
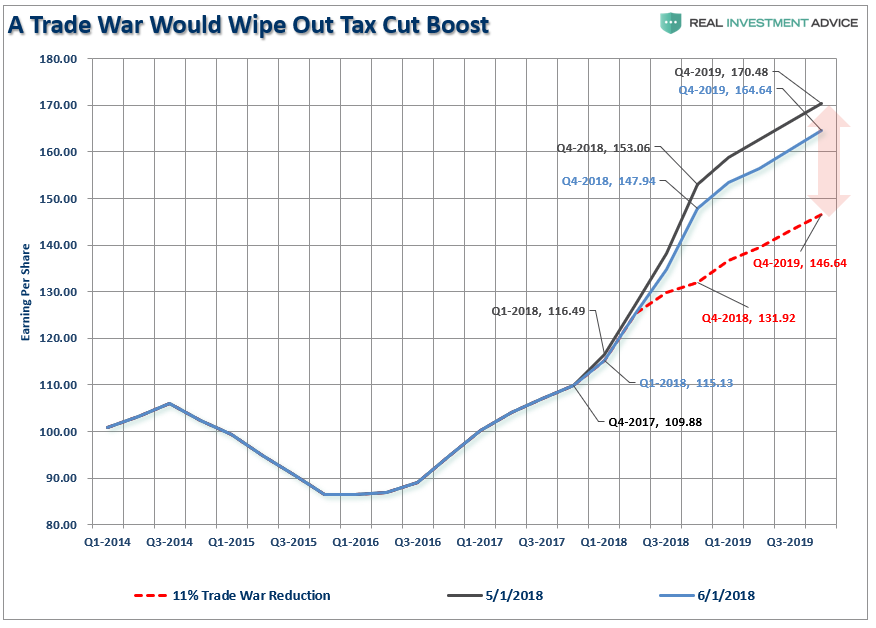
“However, the red dashed line denotes an 11% reduction to those estimates due to a “trade war” as noted by Barclays Bank
‘In a nutshell, the bank calculated that an across-the-board tariff of 10% on all US imports and exports would lower 2018 EPS for S&P 500 companies by ~11% and, thus, completely offset the positive fiscal stimulus from tax reform.’”
As I have often stated in this missive over the last several weeks, we remain invested currently but constantly monitor the risks of what can, and eventually will, go wrong.
Which brings me to my next point.
Charge Of The Light Brigade
My old friend David Rosenberg has an interesting comment this past week.
“The January high in the S&P 500 will prove to be the peak of the bull market and a U.S. recession may start in the next 12 months. Cycles die, and you know how they die? Because the Fed puts a bullet in its forehead.”
He is right. The only question is the timing.
One thing this market has become known for is its resilience. Regardless of the event, “hope” combined with a lot of Central Bank activity has kept the markets pushing higher. But, all good things do come to an end, and history shows the Fed has always led the “last charge of the light brigade.”
For those unfamiliar with the story, the “Charge of the Light Brigade” was a charge of British light cavalry led by Lord Cardigan against Russian forces during the Battle of Balaclava in 1854, during the Crimean War. Lord Raglan, the overall commander of the British forces, had intended to send the Light Brigade to prevent the Russians removing captured guns from overrun Turkish positions, a task well-suited to light cavalry. However, due to miscommunication in the chain of command, the Light Brigade was instead sent on a frontal assault against a different artillery battery, one well-prepared with excellent fields of defensive fire.
Although the Light Brigade reached the battery under withering direct fire and scattered some of the gunners, the badly mauled brigade was forced to retreat immediately. Thus, the assault ended with very high British casualties and no decisive gains. War correspondent William Russell, who witnessed the battle, declared:
“Our Light Brigade was annihilated by their own rashness, and by the brutality of a ferocious enemy.”
This current set up is very much like what faced the British Calvary. A market that is overly bullish, overly complacent and overly valued has already had horrible outcomes for those that charged headlong into it when similar conditions previously prevailed. As the chart below shows, “bears” have gone into complete hibernation.
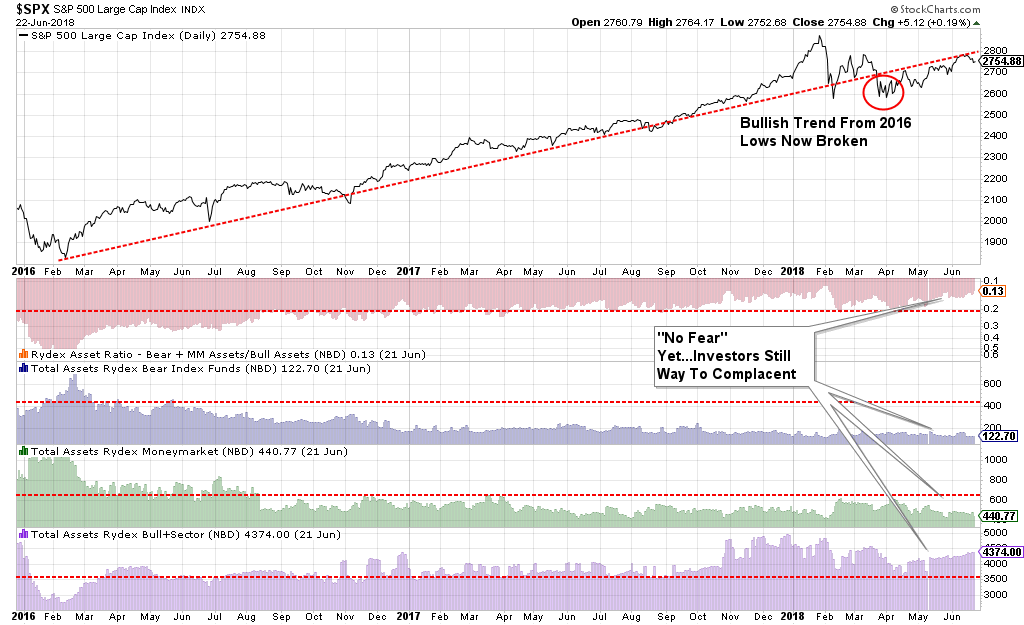
The backdrop of the market currently is vastly different than it was during the “taper tantrum” in 2015-2016, or during the corrections following the end of QE1 and QE2. In those previous cases, the Federal Reserve was directly injecting liquidity and managing expectations of long-term accommodative support. Valuations had been through a fairly significant reversion, and expectations had been extinguished.
None of that support exists currently and, in our opinion, investors are largely ignoring the extreme conditions which currently exist. As David Rosenberg noted:
“We are seeing a significant shift in the markets. The Fed was responsible for 1,000 rally points this cycle so we have to pay attention to what happens when the movie runs backwards.”
This was a point I made last week, that it isn’t just the Fed extracting liquidity and removing accommodation, it has now gone global.
“Combine a “trade war” with a Federal Reserve intent on removing monetary accommodation, both through higher rates and reduction in liquidity, and the market becomes much more exposed to an unexpected exogenous event which sparks a credit-related event. (Of course, it isn’t just the Fed, but also the BOJ and ECB.)”
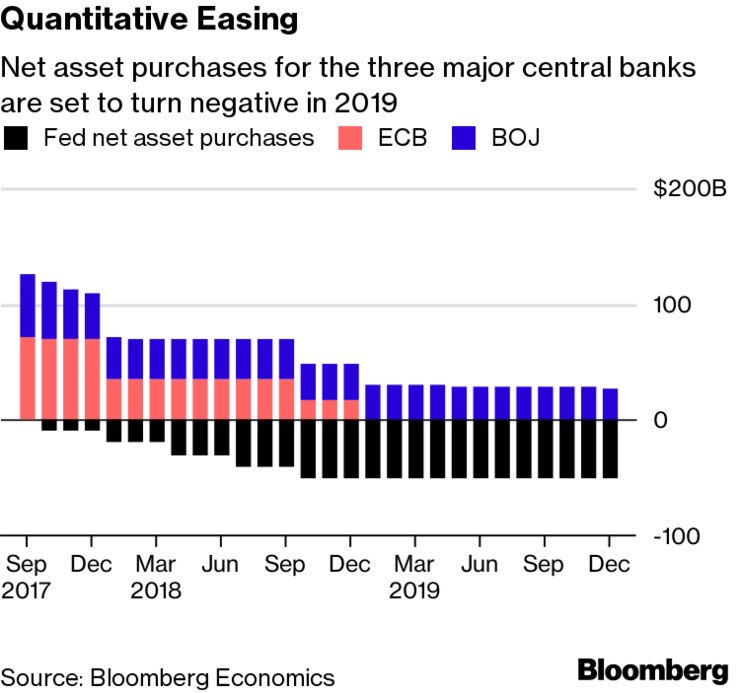
There is a reasonably high possibility, the bull market that started in 2009 is coming to an end. We may not know for a week, a month or even possibly a couple of quarters. Topping processes in markets can take a very long time.
If I am right, the conservative stance and hedges in portfolios will protect capital in the short-term. The reduced volatility allows for a logical approach to further adjustments as a correction becomes more apparent. (The goal is not to be forced into a “panic selling” situation.)
If I am wrong, and the bull market resumes, we simply remove hedges and reallocate equity exposure.
“There is little risk, in managing risk.”
Whether it is sooner, or later, the current run-up in stocks will end very much the same as they always have with investors “annihilated by their own rashness and the brutality of a ferocious enemy.”
For now, investors race forward with swords drawn, shouting the “bull market” battle cry in the face of insurmountable odds solely with a conviction of invincibility.
But such is the nature of every bull market cycle in throughout history.
Invest accordingly.
Market and Sector Analysis
Data Analysis of the Market and Sectors for Traders
S&P 500 Tear Sheet
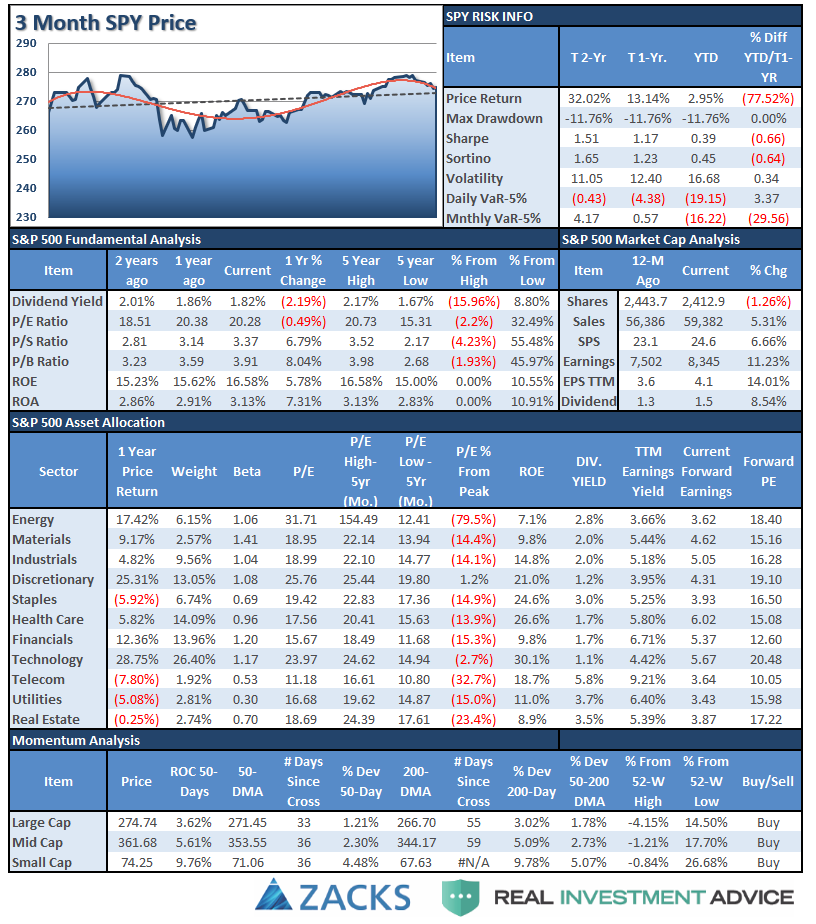
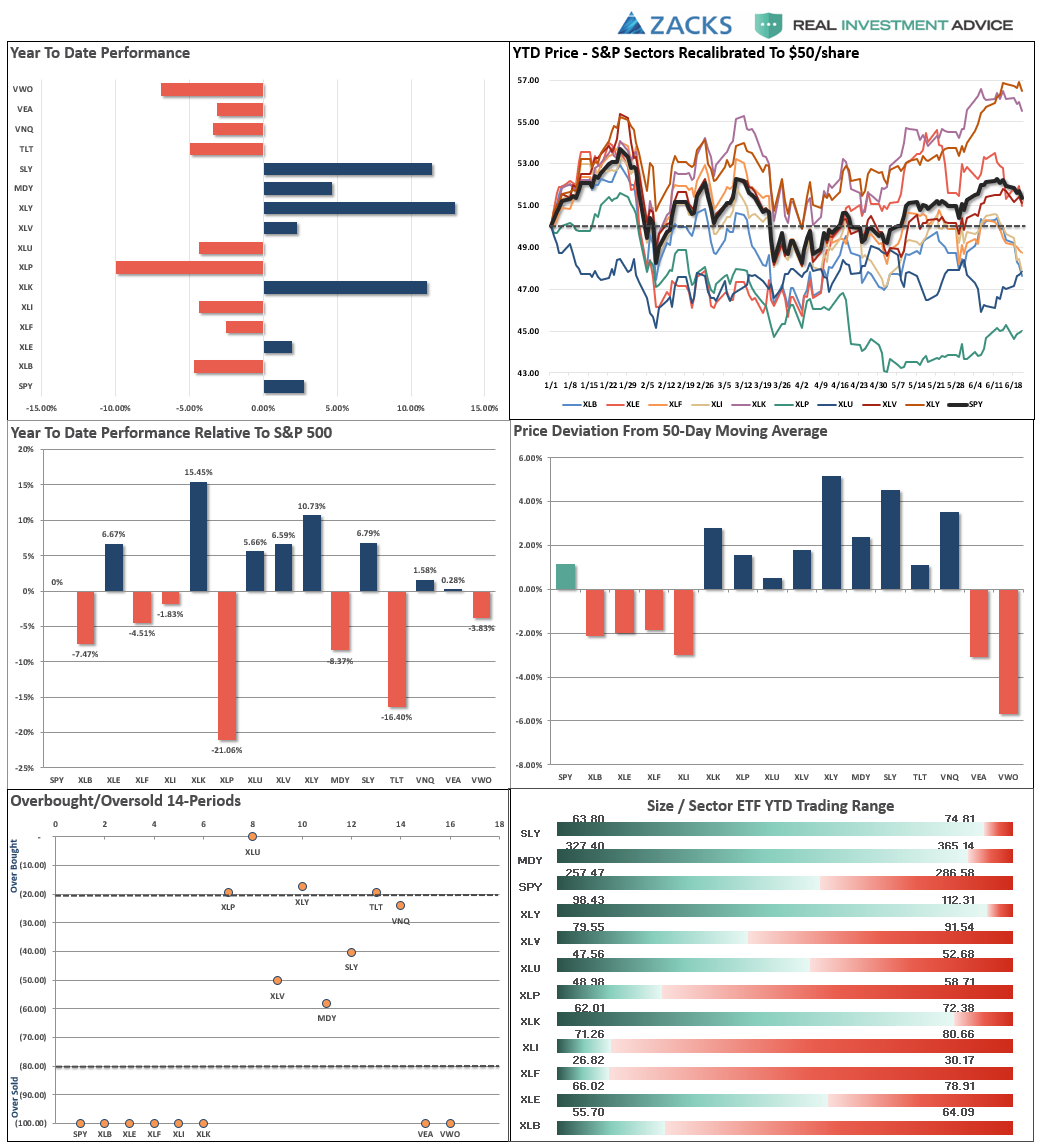
Performance Analysis
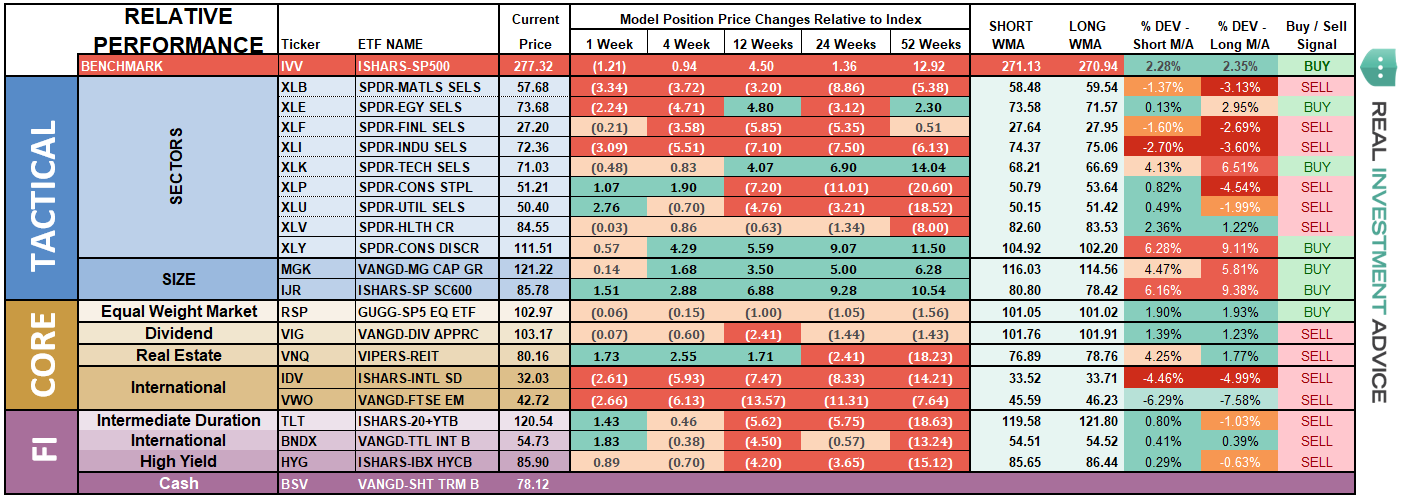
ETF Model Relative Performance Analysis
Sector and Market Analysis:
Last week, trade, tariffs, internet sales tax, and continued rhetoric from the “Twitter-In-Chief” roiled the markets last week, but every “dip” was readily bought keeping bullish underpinnings intact for now.
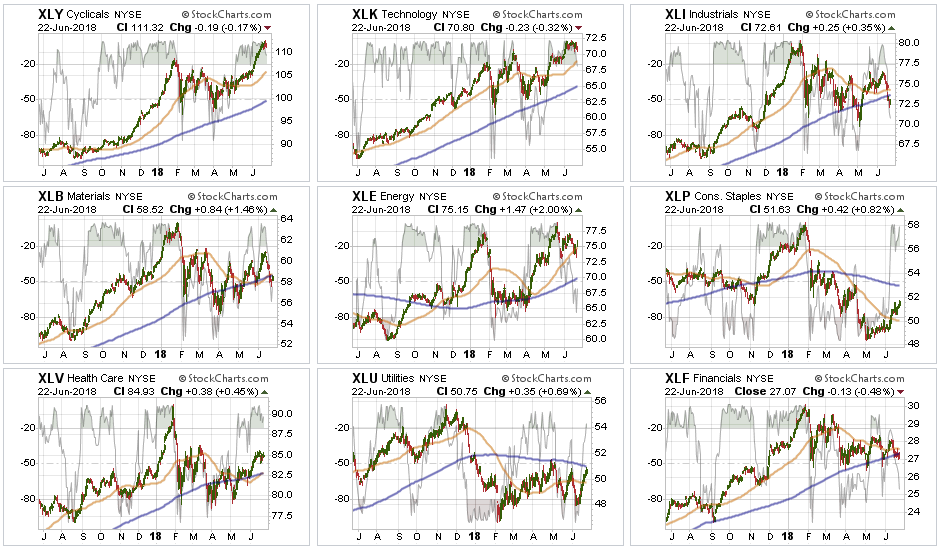
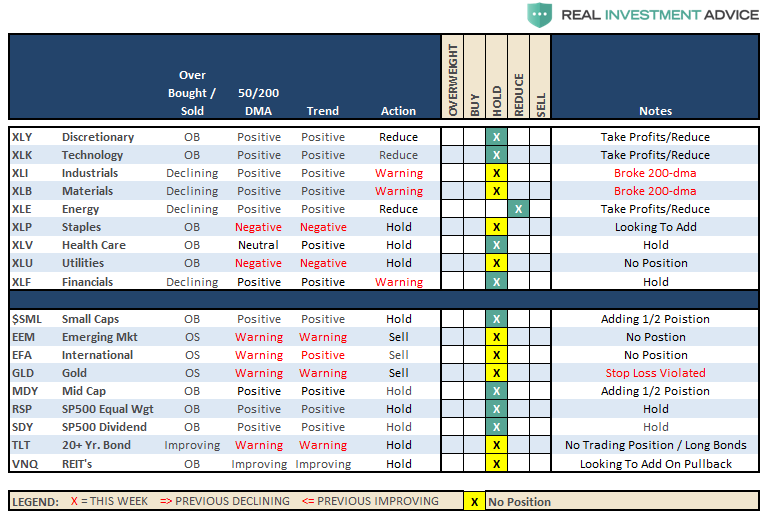
Discretionary: the near vertical escalation in the discretionary sector is a result of the breakout of the consolidation we discussed three weeks ago. As we stated last week, that sharp ramp higher is not healthy and with the sector extremely overbought, we are taking profits and reducing back to portfolio model weights for now.
Technology: as noted last week, has also advanced nicely after breaking out to new highs. However, tech ran into a bit of trouble this past week on the Supreme Court ruling against Wayfair on sales tax. We are also taking profits and reducing portfolios back to target model weights as well.
Healthcare, Staples, and Utilities also picked up in performance recently as money has rotated towards very beaten up sectors in a sector rotation move. As noted last week, we need to see some further improvement before becoming more aggressively exposed to these sectors. Remain underweight these sectors for now.
Financials, Energy, Industrials, and Materials stocks, after a brief spurt of excitement, have all slipped backward. While trends remain in place, for now, remain underweight holdings for until performance improves.
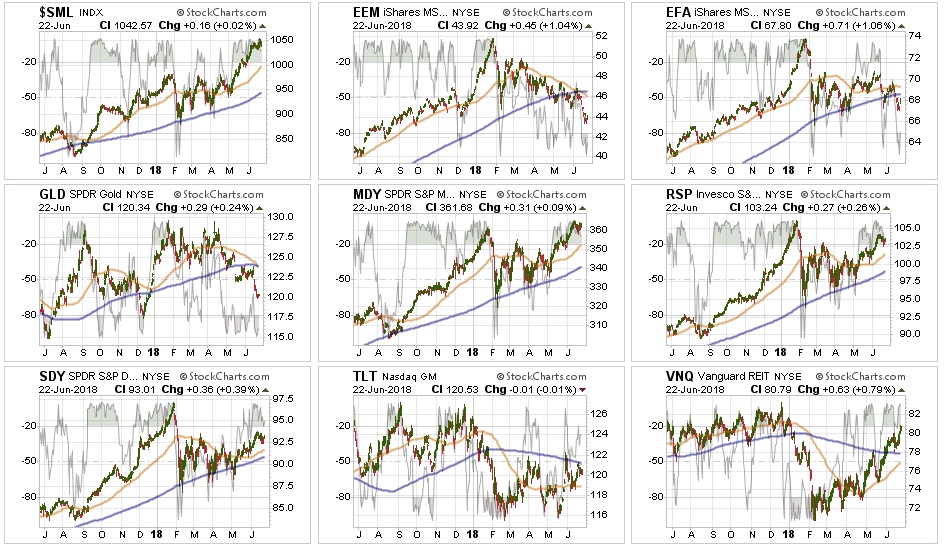
Small-Cap and Mid-Cap continue to lead performance overall. We noted last week, that after small and mid-caps broke out of a multi-top trading range, we needed a pull-back to add further exposure. Last week, we got an opportunity to add modest amounts of both small and mid-cap exposure to portfolios. We are maintaining tight stops for now, and any pullback that doesn’t violate support will provide a better opportunity to increase exposure further.
Emerging and International Markets were removed in January from portfolios on the basis that “trade wars” and “rising rates” were not good for these groups. Furthermore, we noted that global economic growth was slowing which provided substantial risk. That recommendation to focus on domestic holdings in allocations has paid off well in recent months. With emerging markets and international markets continuing to languish, there is no reason to ad exposure at this time. Remain domestically focused to reduce the drag on overall portfolio performance.
Dividends and Equal Weight continue to hold their own and we continue to hold our allocations to these “core holdings.”
Gold as noted last week:
“…we previously suggested to ‘Take profits on positions, and lower your stop to last week’s bottom at $122.’ Again, we see no reason currently to own gold in your portfolio, however, if you do, the $122 stop was violated and all precious metals positions should be closed out for now. There is no ‘fear’ in the financial markets currently to cause a flight to safety and the ‘inflation fears’ are transient as they are directly tied to the surge in oil prices as noted in the main body of this missive.”
There will come a time to own gold, and when there is, we will add it to portfolios. Now is not the time.
Bonds and REITS: Bonds have continued to improve performance despite a continued bullish backdrop to equities. These two things do not generally coincide for long periods, so either, the “bulls” are wrong on stocks or the “bears” are wrong on bonds. While we remain out of trading positions currently, we remain long “core” bond holdings mostly in floating rate and shorter duration exposure. REITs are much more interesting now with a break back above their 200-dma. The sector is extremely overbought, so on a pullback that does violate support, we will add REITs back into our portfolios.
The table below shows thoughts on specific actions related to the current market environment.
(These are not recommendations or solicitations to take any action. This is for informational purposes only related to market extremes and contrarian positioning within portfolios. Use at your own risk and peril.)
Portfolio/Client Update:
The pullback to the previous break out level in the market, along with the positive cross of the 50-dma above the 100-dma, provides us with the ability to opportunistically step up our equity allocations across all models. We have taken, or will be taking early next week, the following actions:
- New clients: Will will look to buy 50% of target equity allocations for new clients.
- Equity Model: We previously added 50% of target allocations. Those positions will be “dollar cost averaged” and 1/2 weight of new holdings will be added opportunistically. (By the way, this is the proper way to “dollar cost average.”)
- Equity/ETF blended models will be brought closer to target allocations. We will add to “core holdings” and add 1/2 weight to new holdings and bring existing holdings up to target model weights.
- Option-Wrapped Equity Model will be brought closer to target allocations and collars implemented.
We will do this opportunistically and continue to work to minimize risk as much as possible. While market action has improved on a short-term basis, we remain very aware of the long-term risks associated with rising rates, excessive valuations and extended cycles.
The actions we are taking currently are simply to take advantage of the current bullish reversal. We will also unwind these positions either by reducing, selling, or hedging if the market environment changes for the worse.
