Market Review And Update
Over the last several weeks, we have repeatedly discussed the “money flow” sell signal that suggested “weakness” in prices. Such was a point we reiterated in last weekend’s newsletter:
“Currently, the money flows remain positive, but ‘sell signals’ are firmly intact. Such suggests downward pressure on prices currently. We do expect that market will likely muster a short-term oversold rally next week. However, the risk of a continued correction in March is likely if money flows deteriorate further.”
Well, the markets did indeed rally as Congress passed the mammoth $1.9 Trillion “pork fest” stimulus package. While this bill is nowhere close to being “reformative,” as touted by the Democrats, it does inject a lot of capital into the economic system. Given that the Federal Reserve will have to monetize the bill’s entirety, it is not surprising the markets get a lift.
In our recent 3-Minutes On Markets and Money video, we discussed the triggering of the short-term “buy signal.”
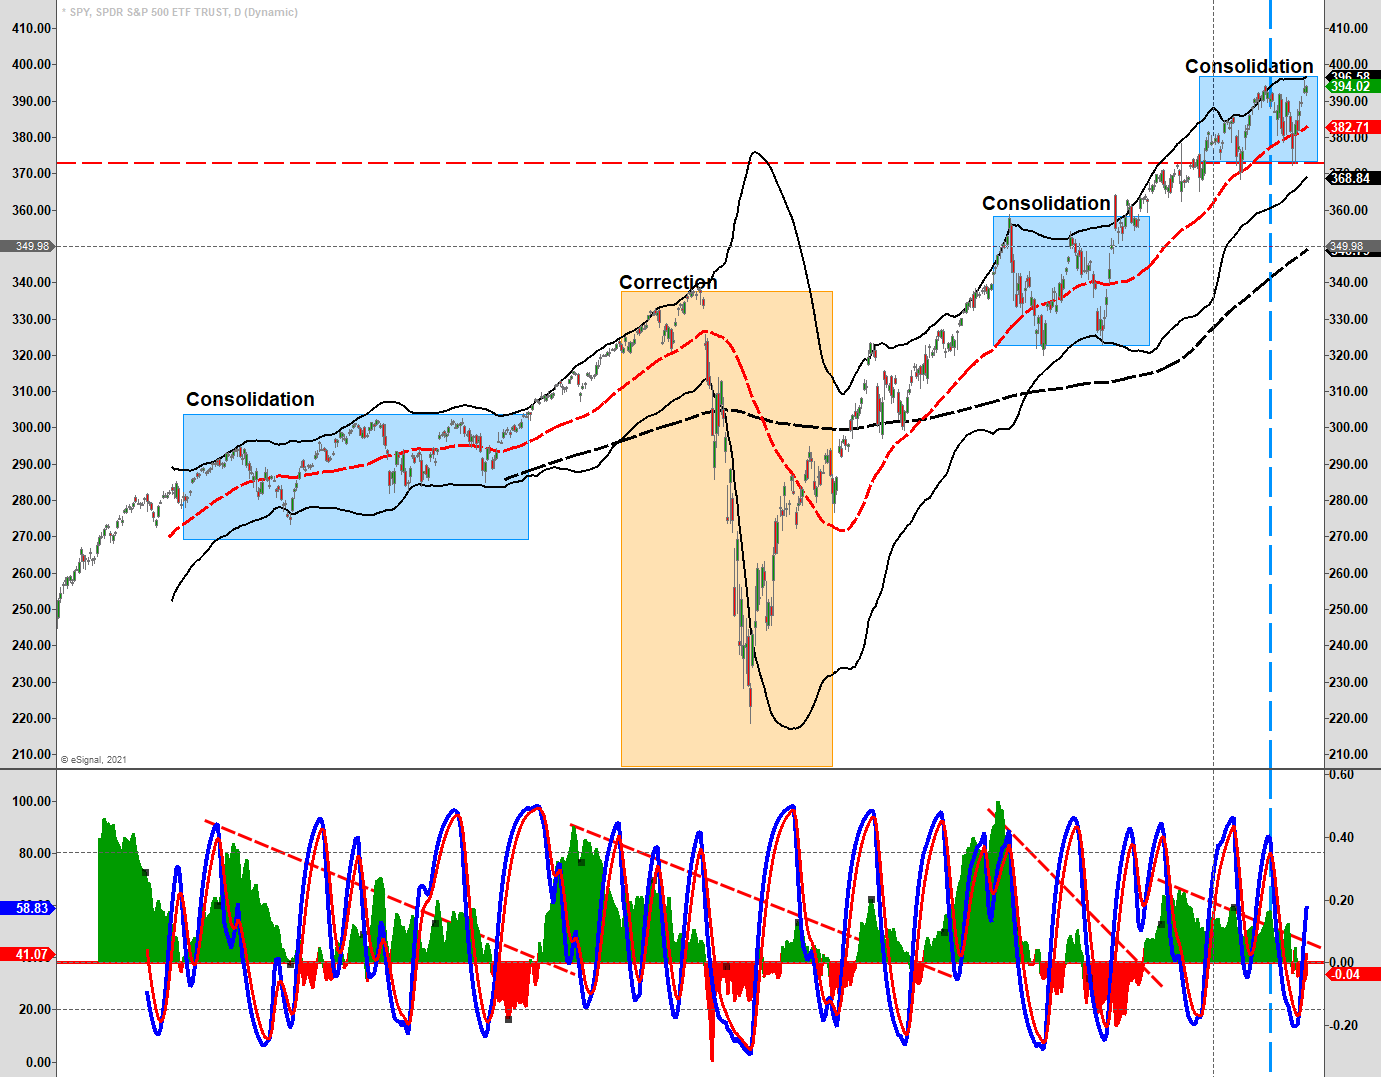
The good news is the rally took the S&P back to all-time highs reducing concerns about a more significant decline in the near term. However, with money flows still trending negatively, we may see some recent advance consolidation next week. Such is consistent with the previous breakouts we have seen over the last several months where money flows were trending negatively.
Unfortunately, as shown, the money flow signals do not distinguish between consolidations and corrections. Such makes risk management a crucial part of the portfolio management process.
A Brief Dichotomy
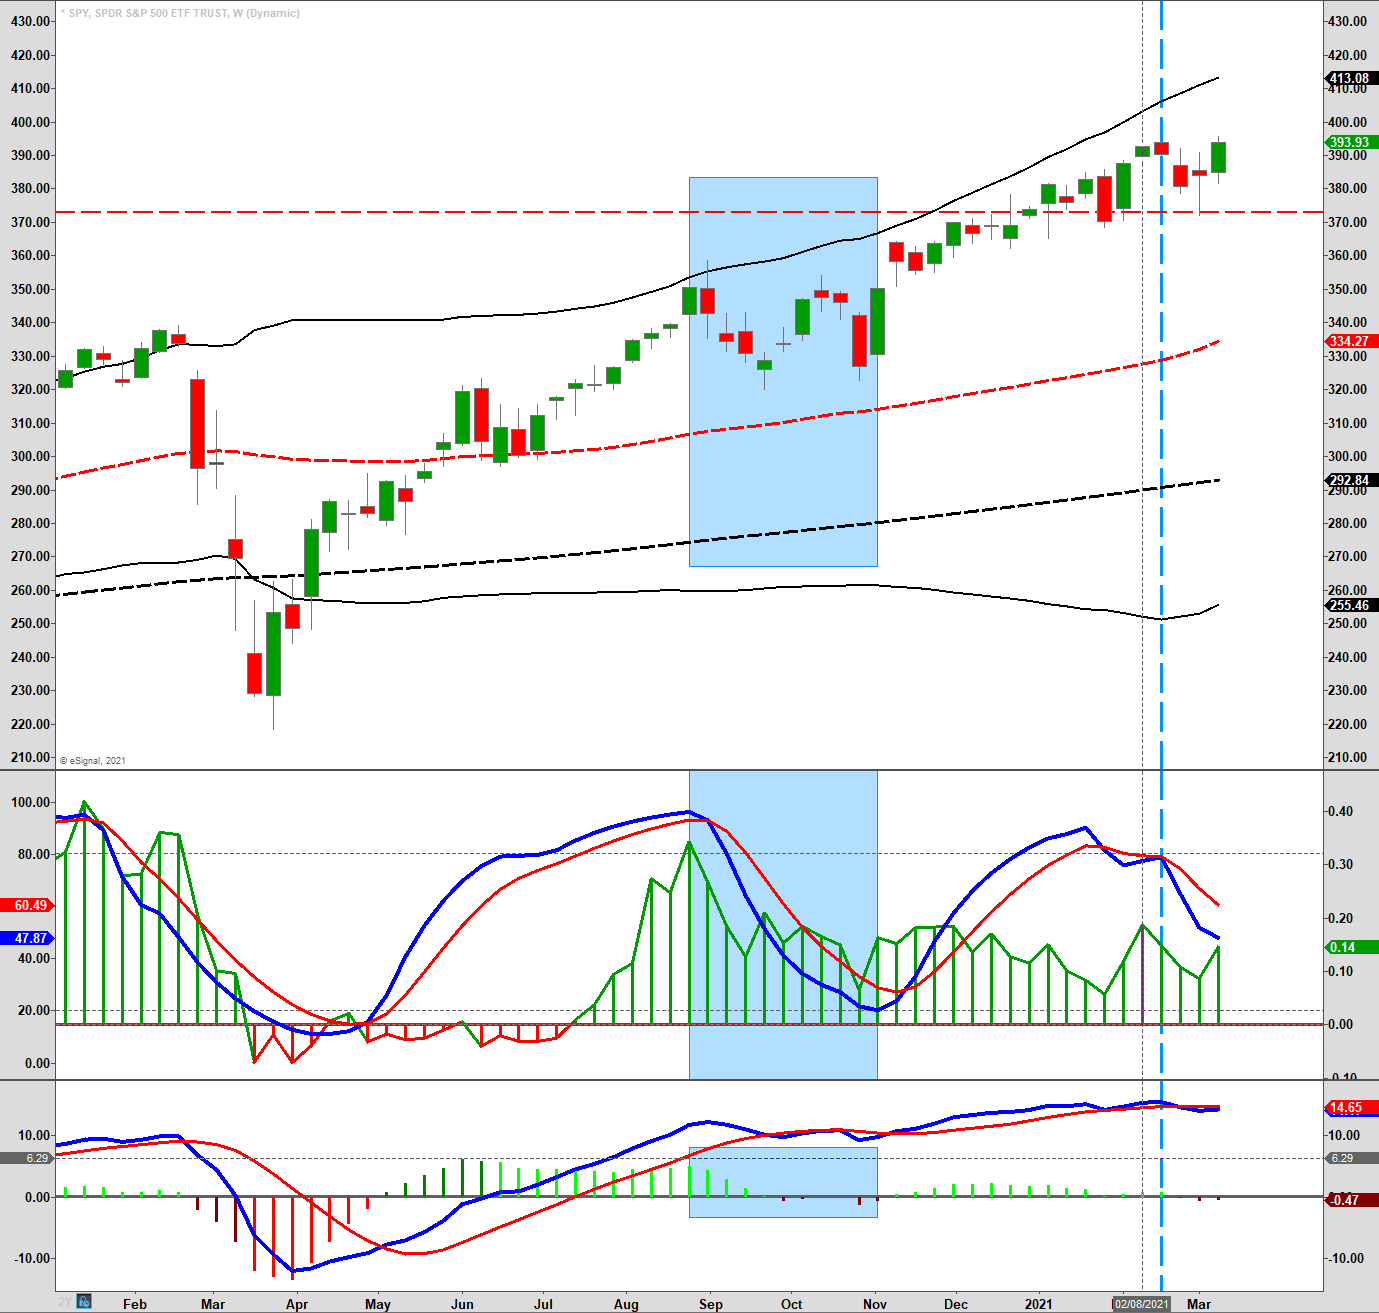
While the short-term indicators for the S&P (via SPY) are undoubtedly positive, suggesting more upside near-term, the longer-term index remains on a confirmed sell signal. Such indicates that downward pressures may continue to limit upside now.
Such was the point made last week, which is worth reiterating:
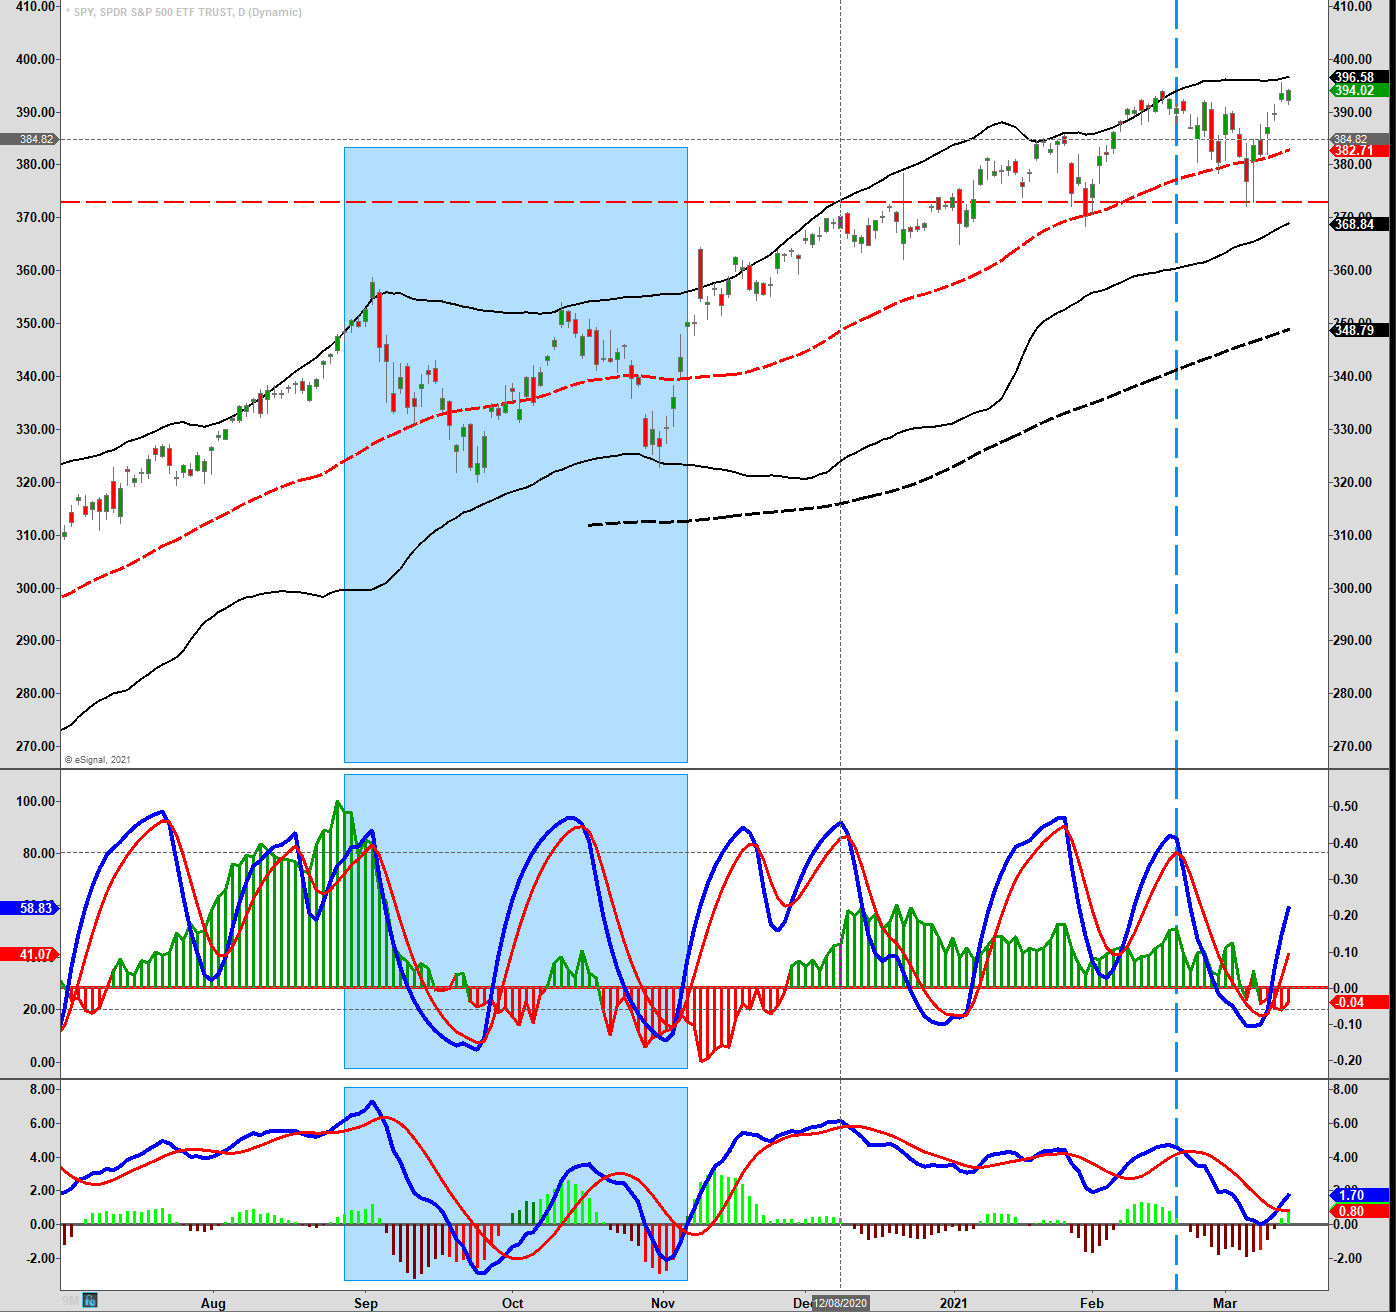
“The dichotomy between the daily and weekly charts suggests we may well see a rally in the short-term, but another correction following. The last time we had the current setup with our indicators was in September and October of 2020, which provided two 10% corrections before the consolidation process was over.”
Chart updated through Friday
Currently, that seems to be the likely scenario. With valuations still extended, the recent correction didn’t reduce speculative fervor. Furthermore, prices remain well deviated above long-term means, particularly in the small and mid-cap space.
While more stimulus will likely support prices over the next few weeks, the threat of rising inflation and interest rates could undermine growth expectations. As we will discuss in our positioning update below, we did increase our exposures this week. However, we also continue to suggest some caution for now.
Speculation Still Alive And Well
My colleague Doug Kass made a critical observation this week:
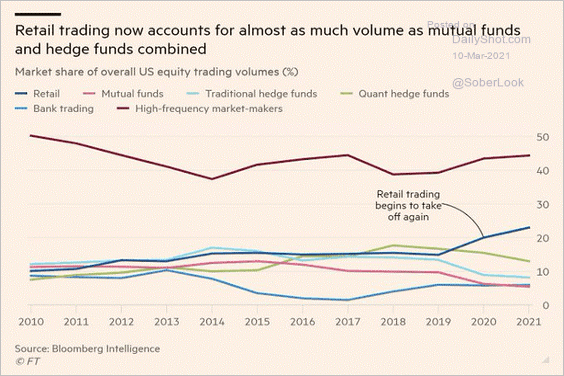
“In my decades of investing experience, I have not seen such mindless and uninformed speculation as I have witnessed recently. Indeed, in nominal dollar terms (and led by retail traders, see chart below) it is far in excess of the dot.com boom.”
He is correct. The interesting thing about this chart is that it explains the astronomical surge in “small-cap” stocks recently, which is far above any logical expectation of future earnings and economic growth. The reality is that retail traders have been speculating in very low-priced stocks where they can buy more shares versus large traders, who buy higher-priced shares with more liquidity. Such shows up in the deviation of the volume traded.
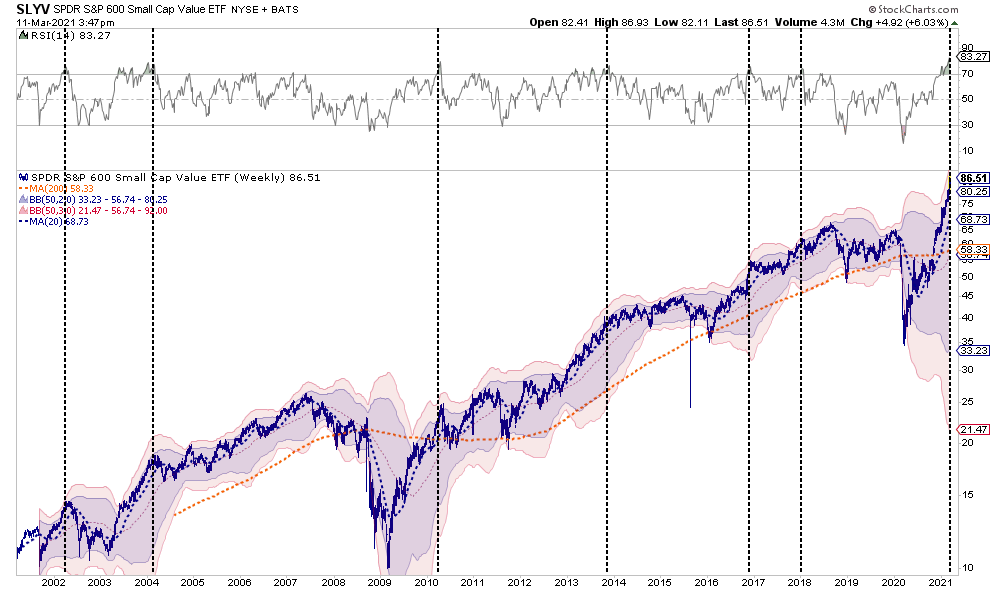
There is no fundamental basis to support the chart below of the SPDR® S&P 600 Small Cap Value ETF (NYSE:SLYV). Small-cap “value,” of which I would argue there is little value considering valuations are at historical extremes, is currently trading at near 4-standard deviations of the 1-year moving average. Such is a level never seen before and one not likely to resolve well.
As Doug notes:
“The Bible says (Proverbs 16:18) that ‘pride goes before destruction, a haughty spirit before a fall.’ Even William Shakespeare warned that ‘dreams are the children of an idle brain, begot of nothing but vain fantasy.’
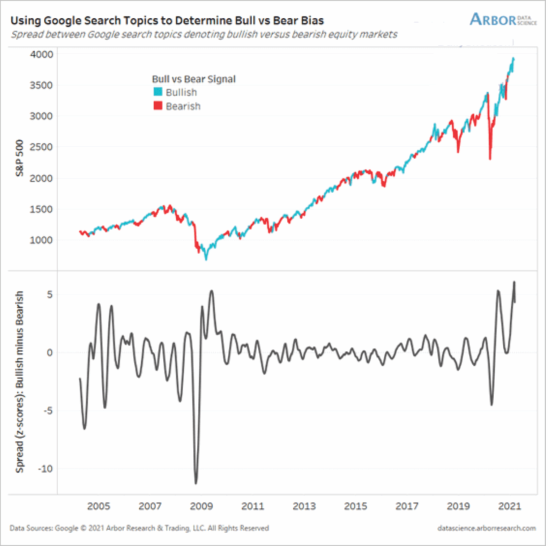
Adopting a YOLO mentality (“you only live once”), speculation begot initially by analphabetic retail traders with little historical market perspective, and even less micro (individual company) knowledge. Using Robinhood and other commission free platforms and ‘Reddit’ as their investment research and communities, such is now spreading and is morphing into an institutional experience and phenomenon.
Of course, I need to remind you of that vital point from John Maynard Keynes:
“The markets can remain irrational longer than you can remain solvent.”
A Boat Load Of Cash, No Place To Spend It
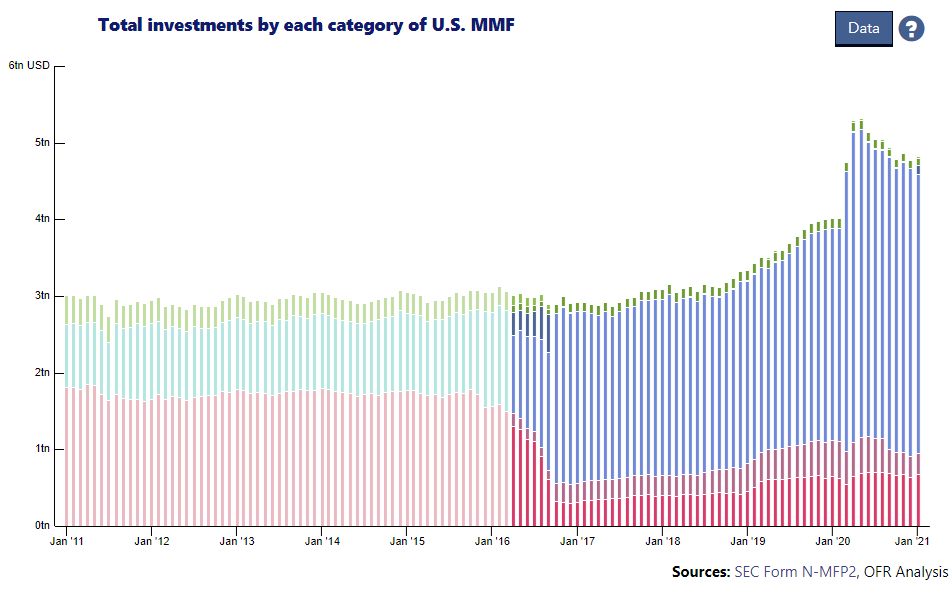
One of the reasons the market can certainly continue to “remain irrational” is from the “mountain of cash” in money market accounts.
No, this is not the “cash on the sidelines” argument which I debunked previously.
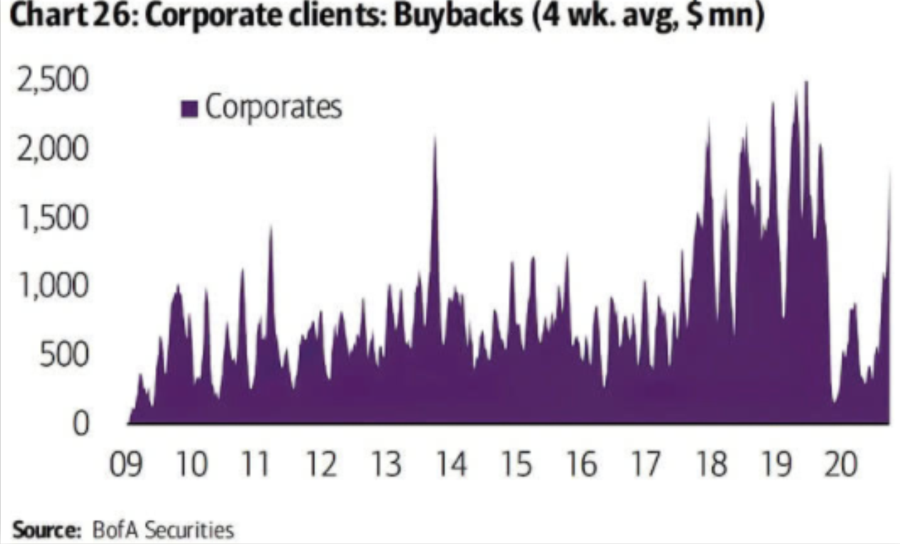
Following the pandemic, corporations drew down credit lines and hoarded cash due to economic uncertainty. Now, with expectations of recovery, corporations are once again beginning to deploy that cash.
The bad news is they are using those funds for share repurchases. While not necessarily bad, it is the “least best” use of the company’s cash. Instead of expanding production, increasing sales, acquiring competitors, or making capital investments, the money gets used for a one-time boost to earnings on a per-share basis.
I previously discussed how nearly 100% of the net purchases of stock were from corporate buybacks. Share buybacks ARE NOT a return of capital to shareholders. To wit:
“Yes, share purchases can be good for current shareholders if the stock price rises, but the real beneficiaries of share purchases are insiders where changes in compensation structures have become heavily dependent on stock-based compensation. Insiders regularly liquidate shares ‘given’ to them as part of their overall compensation structure to convert them into actual wealth.
‘Corporate executives give several reasons for stock buybacks but none of them has close to the explanatory power of this simple truth: Stock-based instruments make up the majority of their pay and in the short-term buybacks drive up stock prices.’ – Financial Times
The SEC confirmed the same:
‘SEC research found that many corporate executives sell significant amounts of their own shares after their companies announce stock buybacks, Yahoo Finance reports.'”
While this certainly will support higher asset prices in the short-term, it will widen the “wealth gap” long-term.
Yes, Rising Rates Will Matter
“What does it mean for equities if rates and yields do indeed go higher? Fortunately, to the surprise of many, stocks historically do very well when rates increase. Since 1996, stocks gained all 11 times we saw higher rates” – LPL Research, 2018
That was a quote from my article in March of 2018. Expect over the next several weeks to hear a regurgitation of that idea as the media encourages individuals to chase asset prices higher. However, as I noted then:
“The point is that in the short-term the economy and the markets (due to the current momentum) can DEFY the laws of financial gravity as interest rates begin to rise. However, as rates continue to rise they ultimately act as a ‘brake’ on economic activity.”
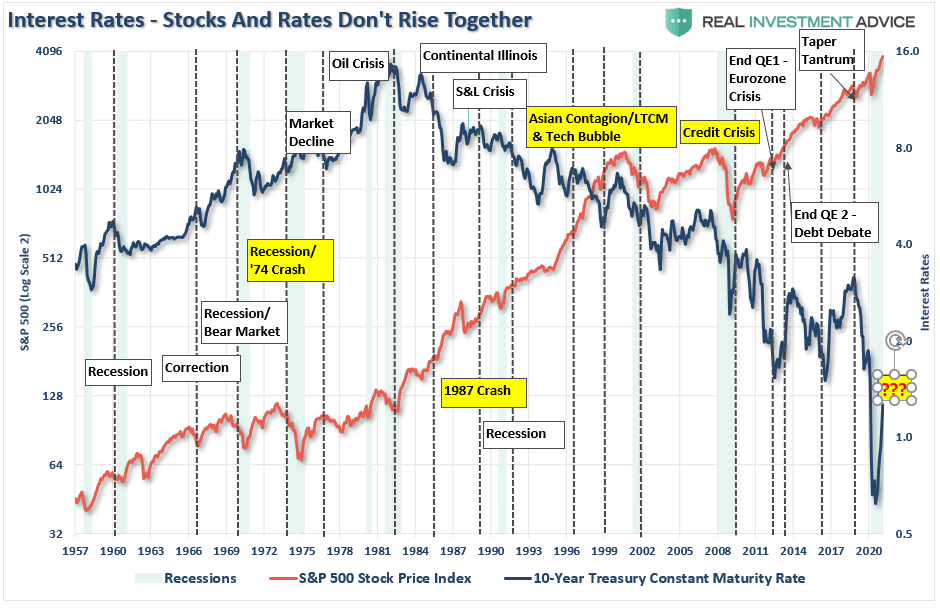
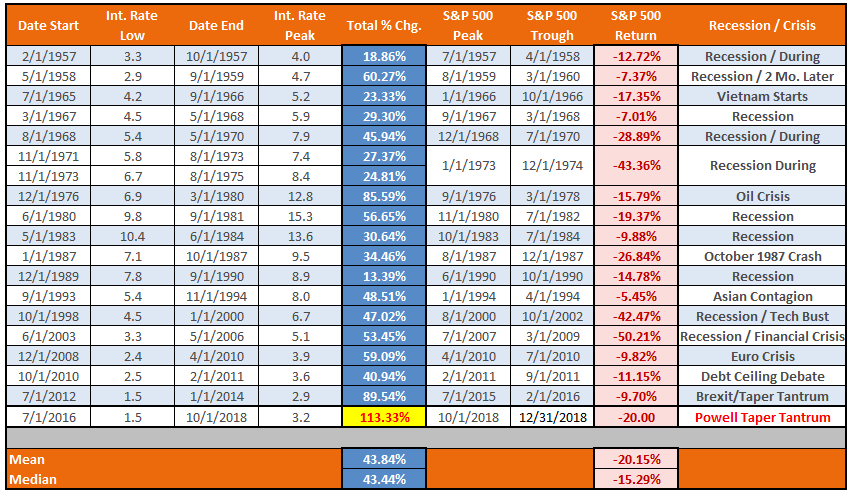
Notably, the claim that higher rates lead to higher stock prices falls into the category of “timing is everything.” As shown below, just a few short months after LPL’s comments that higher rates don’t matter, the stock market fell by 20% between October and December.
However, that was not an isolated case. Throughout history, increases in interest rates negatively impact equity prices. It is just the function of “time” until “something breaks.”
While the markets and economy may seem to perform okay as rates rise initially, the eventual negative impact leads to losses in investment capital.
Please pay attention to interest rates; they are likely telling you a lot more than you think.
Portfolio Update
Last week we concluded our missive stating:
“As discussed previously, ‘risk happens fast.’
It is essential not to react emotionally to a sell-off. Instead, fall back on your investment discipline and strategy. Importantly, keep your portfolio management process as simplistic as possible.
- Trim Winning Positions back to their original portfolio weightings. (ie. Take profits)
- Sell Those Positions That Aren’t Working. If they don’t rally with the market during a bounce, they will decline more when the market sells off again.
- Move Trailing Stop Losses Up to new levels.
- Review Your Portfolio Allocation Relative To Your Risk Tolerance. If you have an aggressive allocation to equities at this point of the market cycle, you may want to try and recall how you felt during 2008. Raise cash levels and increase fixed income accordingly to reduce relative market exposure.”
While this may indeed turn out to be a buying opportunity in the short-term, mainly if the Government passes the next “stimulus bill,” cleaning up your portfolios allows you to adjust to the markets next advance.
Fortunately, that is what happened this week as the passage of the “stimulus bill” sparked “bullish spirits.” As noted, we reviewed our portfolios and increased exposure to fundamentally strong stocks we are holding long-term. We also added to some of our beaten-up “momentum” names.
We are still slightly overweight cash but very short on duration in our bond portfolios for now. Such puts us a little more exposed to “risk” than we like, but the market is not giving us many options for now.
However, we will continue to follow our investment process for now and manage risk accordingly.

