Get 40% Off
⚠ Earnings Alert! Which stocks are poised to surge?
See the stocks on our ProPicks radar. These strategies gained 19.7% year-to-date.
Unlock full list

Bullish Flag Pattern Forms In Chart Of Al Sorayai Trading

Published 03/03/2015, 05:02 AM
Updated 07/09/2023, 06:31 AM

A bullish flag pattern has formed in the chart of Al Sorayai Trading&Industrial Group (SE:1213) (ALSORAYAI), with the stock attempting a breakout over the past few days. The bullish flag is a consolidation pattern that takes the form of a small descending parallel channel. It follows a clear bullish move.

Three weeks ago ALSORAYAI hit resistance at 19.45, the top of the flag, and also completed a 38.2% Fibonacci retracement of the downtrend coming off the 27.80 swing high. It then retraced off that high until finding support at 17.65 two weeks ago, thus forming a flag pattern. The quality of that low is enhanced as it is also in the region of the 21-day exponential moving average (ema). As of the past couple of the days the 21-day ema and 55-day ema have converged and now identify the same price support area of approximately 18.12.
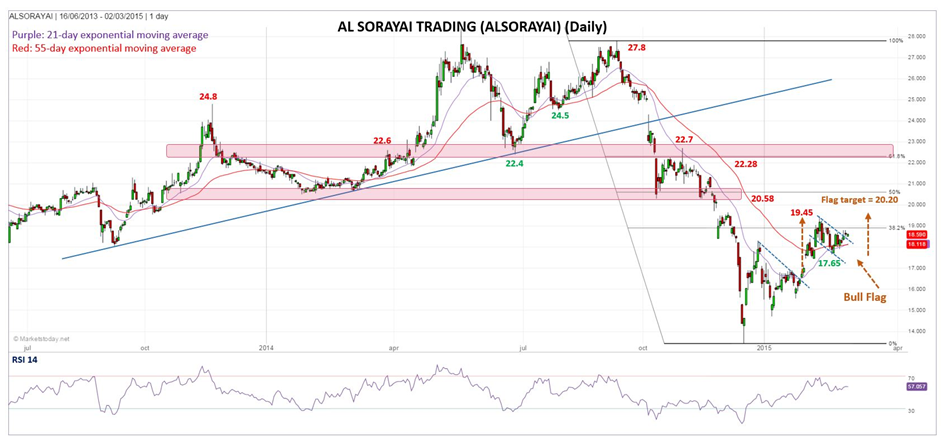
Alsorayi Trading Daily

A bullish breakout is indicated on trade above 18.95. At that point the stock will be back above the 38.2% Fibonacci retracement (18.87) and the 21-day ema will have risen above the 55-day ema for first time since the beginning of October 2014. The 14-period RSI is at 57.06; not yet in overbought territory.

Further confirmation of the breakout is on trade above the 19.45 peak, which will also trigger a continuation of the uptrend.

There are two more apparent target zones if a breakout and subsequent follow-through occurs. The first would be from approximately 20.20 to 20.58 (6.6%+ above breakout), the target measured from the flag pattern, and the 50% retracement level, respectively.

If Alsorayai keeps going higher from there then the next target zone would be from around 22.28 to 22.70 (17.6%+ from breakout), which is the confluence of the 61.8% Fibonacci retracement and previous support and resistance that occurred over the course of few months in 2014.

Latest comments

Risk Disclosure: Trading in financial instruments and/or cryptocurrencies involves high risks including the risk of losing some, or all, of your investment amount, and may not be suitable for all investors. Prices of cryptocurrencies are extremely volatile and may be affected by external factors such as financial, regulatory or political events. Trading on margin increases the financial risks.
Before deciding to trade in financial instrument or cryptocurrencies you should be fully informed of the risks and costs associated with trading the financial markets, carefully consider your investment objectives, level of experience, and risk appetite, and seek professional advice where needed.
Fusion Media would like to remind you that the data contained in this website is not necessarily real-time nor accurate. The data and prices on the website are not necessarily provided by any market or exchange, but may be provided by market makers, and so prices may not be accurate and may differ from the actual price at any given market, meaning prices are indicative and not appropriate for trading purposes. Fusion Media and any provider of the data contained in this website will not accept liability for any loss or damage as a result of your trading, or your reliance on the information contained within this website.
It is prohibited to use, store, reproduce, display, modify, transmit or distribute the data contained in this website without the explicit prior written permission of Fusion Media and/or the data provider. All intellectual property rights are reserved by the providers and/or the exchange providing the data contained in this website.
Fusion Media may be compensated by the advertisers that appear on the website, based on your interaction with the advertisements or advertisers.
© 2007-2024 - Fusion Media Limited. All Rights Reserved.