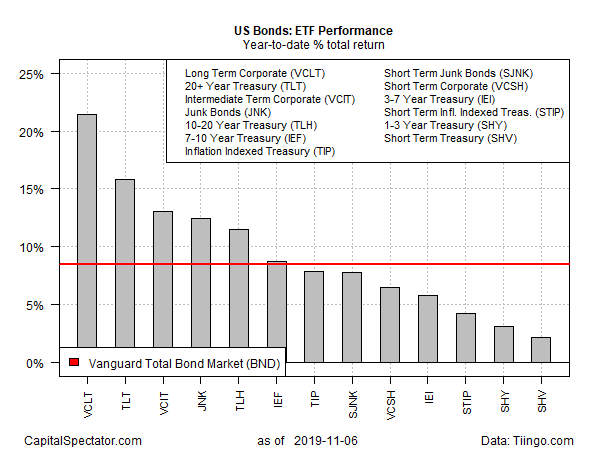
Fixed-income investing has been a winner in no small degree this year. Throwing money at almost any slice of U.S. bonds has been a winning decision, based on a set of exchange-traded funds. Notably, favoring bigger duration risks has delivered bigger returns.
For the top-performing slice of U.S. fixed income, this year’s results so far have, at times, rivaled the extraordinary run in U.S. stocks. Indeed, the current year-to-date leader on our bond ETF list could be mistaken for an equity fund if you looked only the price histories. Vanguard Long-Term Corporate Bond (Vanguard Long-Term Corporate Bond (NASDAQ:VCLT) is up a red-hot 21.4% so far this year (through Nov. 6). That’s behind the U.S. stock market (SPY (NYSE:SPY)), although a few weeks back VCLT was in the lead.
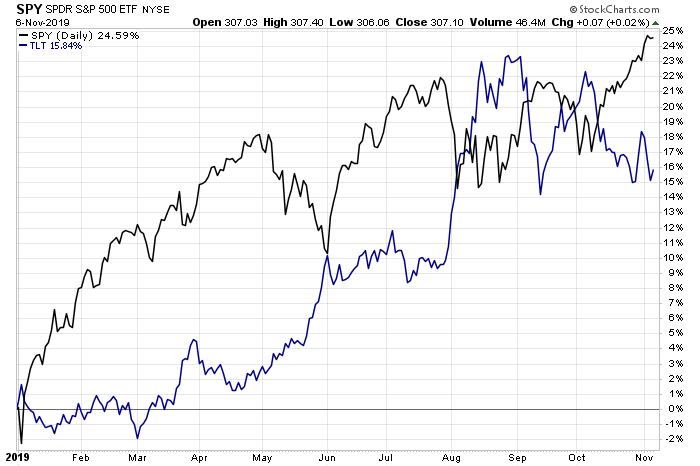
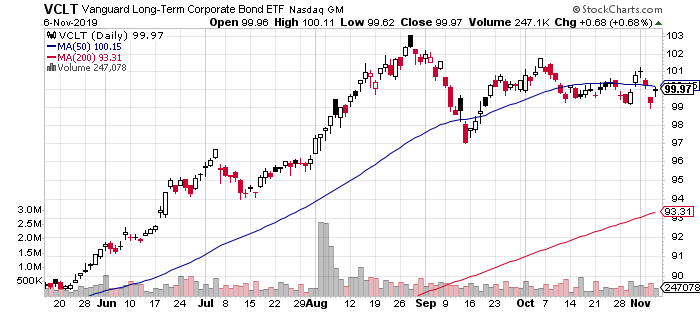
VCLT’s rally, however, is looking a bit tired these days. After a virtually non-stop run through early September, the fund has been mostly treading water over the past two months.
The possibility of a partial resolution to the U.S.-China trade war is a factor weighing on the bond market this week. “Trade progress via the U.S. and China being said to consider partial tariff rollbacks, coupled with most recent top-tier data prints coming in stronger than consensus, paints a textbook picture for higher rates and equities as near-term recessionary fears moderate,” writes Jon Hill, an interest-rate strategist at BMO Capital Markets, in a research note to clients.
The rear-view mirror, however, still looks impressive for U.S. bonds generally. Indeed, even the investment-grade benchmark for fixed income — Vanguard Total Bond Market (Vanguard Total Bond Market (NYSE:BND)) – is posting a solid 8.4% total return so far in 2019.
Some analysts are advising that changes in central bank policy may create new headwinds for bonds from this point forward.
“We are past the peak of central banks easing,” warns Peter Schaffrik, a global macro strategist at RBC Capital Markets. “You may get a few more cuts here and there, but the extreme cutting phase is over. And with that, yields in the U.S. and globally are at risk of going higher. I’d be cautious about fixed income now.”
Nonetheless, the bond bulls can point to recent data that shows economic growth is still slowing, which implies that more monetary easing is on the cards. If so, bond prices can still rise further.
In the U.S., for instance, the Atlanta Fed’s GDPNow model this week trimmed the outlook for fourth-quarter output to a weak 1.0% increase, down from 1.9% in Q3.
For the moment, however, Fed funds futures are pricing in a high probability that the Fed will leave interest rates unchanged at the next FOMC meeting on Dec. 11.
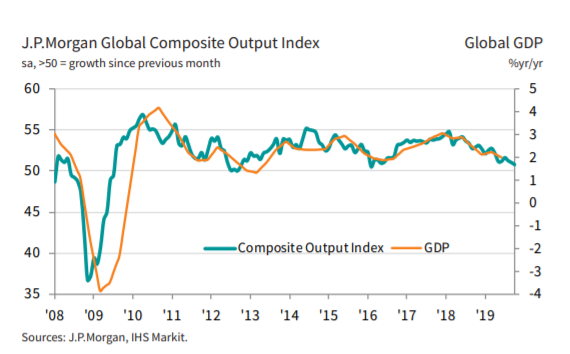
The global trend, however, still appears to be sliding. The JP Morgan Global Composite Output Index, a proxy for global GDP, slipped to its lowest reading in October in nearly four years — indicating a near-stagnant pace of growth.
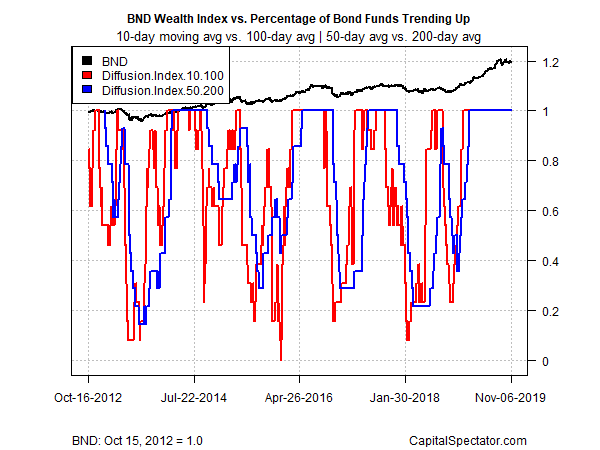
If there’s trouble brewing for U.S. bonds, it’s not yet obvious in the pricing trend via a set of moving averages. The first metric compares each ETF’s 10-day moving average with the 100-day average — a proxy for short-term trending behavior (red line in chart below). A second set of moving averages (50 and 200 days) offers an intermediate measure of the trend (blue line). The indexes range from 0 (all funds trending down) to 1.0 (all funds trending up). For the moment, the crowd is pricing sunny skies ahead for U.S. fixed income. Indeed, both metrics are currently reflect perfect bullish scores.
