Get 40% Off
⚠ Earnings Alert! Which stocks are poised to surge?
See the stocks on our ProPicks radar. These strategies gained 19.7% year-to-date.
Unlock full list

BTC/USD Technical Analysis: The Last 24 Hours

Published 10/17/2019, 12:16 PM
Updated 07/09/2023, 06:32 AM
BTC/USD

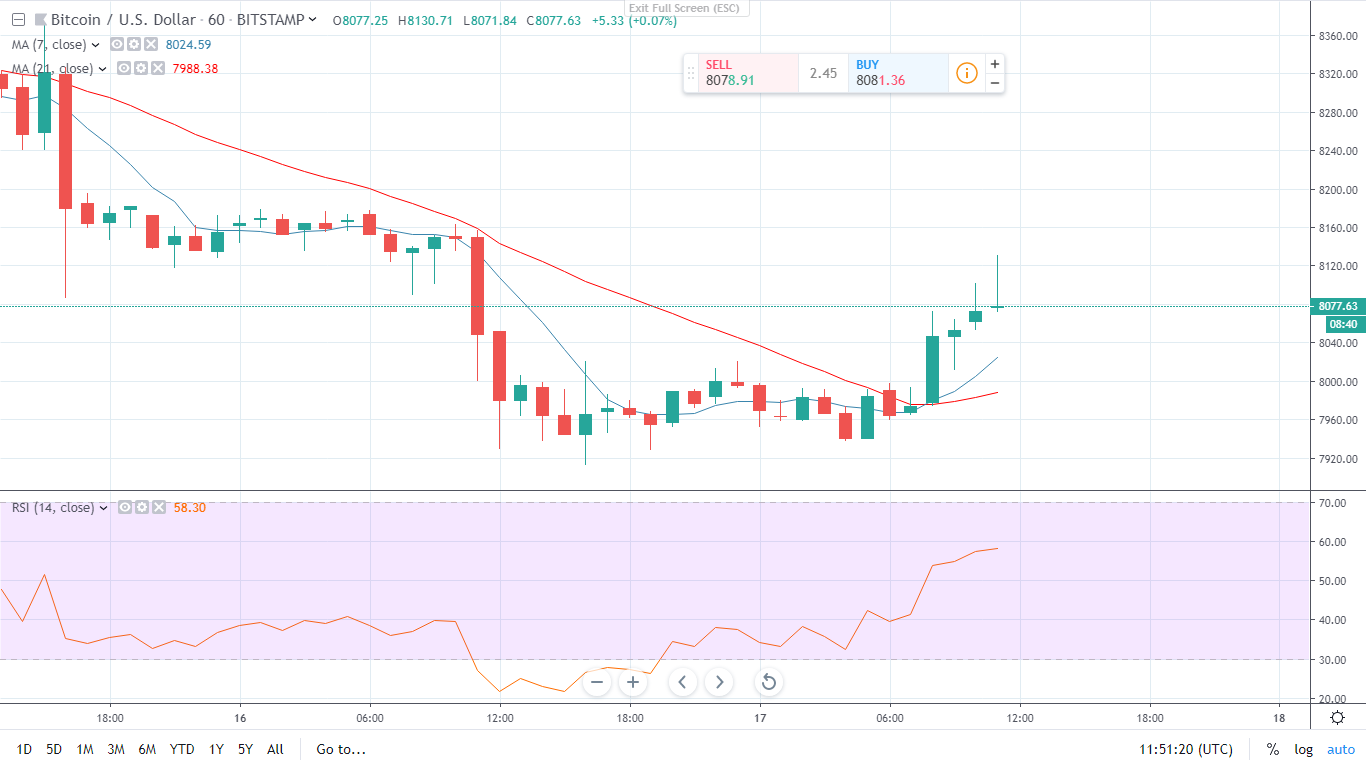
The Bitcoin (BitfinexUSD) trading pair started the last 24 hours with a bearish engulfing that brought the price tumbling down from USD 8318 to a low of USD 8081.This was further reinforced by the 21 day Moving Average that crossed over the 7 day Moving Average. The pair then started trading on a sideways market as it was consolidating before the next market move. During this sideways trending, the pair seemed to find support at USD 8121 and resistance at USD 8191.During this time, The RSI was still below 40 seemingly indicating an oversold market. It wasn’t long before the support levels were breached and the price tumbled to a new low below USD 8000.The RSI further dipped to less than 30 solidifying the notion that these levels were indeed oversold.

The price then went into consolidation with the USD 8000 mark seemingly acting as the new resistance levels. During this time, the 21 day Moving Average had still created a wide margin against the 7 day Moving Average. New support levels seemed to be defined at USD 7930.However, the USD 8000 psychological resistance levels were soon breached to the upwards as the bulls managed to pull the price up past the USD 8000 mark. The 7 day Moving Average also went over the 21 day Moving average seemingly paving way for a bullish engulfing that drove the price to a high of 8085.The RSI also seemed to shun the oversold region and is seemingly headed North with the tip firmly pointed towards 60.

Short-Term Forecast

First Scenario: we expect that in the next few hours, the pair should find temporary resistance at the ranges of 8100-USD 8200.If these are breached to the northwards, then the next target would be USD 8350.

Second scenario: The RSI is between the levels of 40 and 60 seemingly signifying that the bulls may lack the momentum to drive the price past the 8100 levels. If this is the case, then support should be placed at USD 8000 as we prepare for a range bound market. “I think Bitcoin has the potential to keep its current value for a short time and I expect it to come back up again in the coming months,” said Hussain Abu Aziz, CEO of AZB.

AZB is one of the best marketing companies for blockchain projects in the Middle East, and has proven its marketing strategy with many projects.

Latest comments

I don't think this analysis is good enough, you can be bullish and that's good, we all are, however the momentum is totally to the downside, and the next support levels you missed are important since it looks more likely BTC will reach them during the next few hours or days. BTC needs a breath at the support level of $7,600 or even below to the $7,200 if we want BTC to bounce back above the 200 Daily MA. so that can resume to its bullish long term trend, considering all long terms indicators are bullish and intact.
Risk Disclosure: Trading in financial instruments and/or cryptocurrencies involves high risks including the risk of losing some, or all, of your investment amount, and may not be suitable for all investors. Prices of cryptocurrencies are extremely volatile and may be affected by external factors such as financial, regulatory or political events. Trading on margin increases the financial risks.
Before deciding to trade in financial instrument or cryptocurrencies you should be fully informed of the risks and costs associated with trading the financial markets, carefully consider your investment objectives, level of experience, and risk appetite, and seek professional advice where needed.
Fusion Media would like to remind you that the data contained in this website is not necessarily real-time nor accurate. The data and prices on the website are not necessarily provided by any market or exchange, but may be provided by market makers, and so prices may not be accurate and may differ from the actual price at any given market, meaning prices are indicative and not appropriate for trading purposes. Fusion Media and any provider of the data contained in this website will not accept liability for any loss or damage as a result of your trading, or your reliance on the information contained within this website.
It is prohibited to use, store, reproduce, display, modify, transmit or distribute the data contained in this website without the explicit prior written permission of Fusion Media and/or the data provider. All intellectual property rights are reserved by the providers and/or the exchange providing the data contained in this website.
Fusion Media may be compensated by the advertisers that appear on the website, based on your interaction with the advertisements or advertisers.
© 2007-2024 - Fusion Media Limited. All Rights Reserved.