
Bitcoin analytics and the most likely scenario for the BTC/USD price movements in the near future. In this post I applied the following tools: fundamental analysis, all-round market view, market balance level, volume profile, graphic analysis, trendline analysis, Renko Kagi chart, Line Break chart, Tic-Tac-Toe chart.
Dear friends,
Welcome to my daily series of crypto price forecasts. Another week is over, and so it is time to update the trading scenario for BTC/USD. As usual, I’ll analyze both fundamental and technical factors, suggesting a full BTC/USD analysis, the most popular cryptocurrency pair.
To revise my trading scenario, let’s check how accurate the previous one was, to match the crypto market moves during the recent week.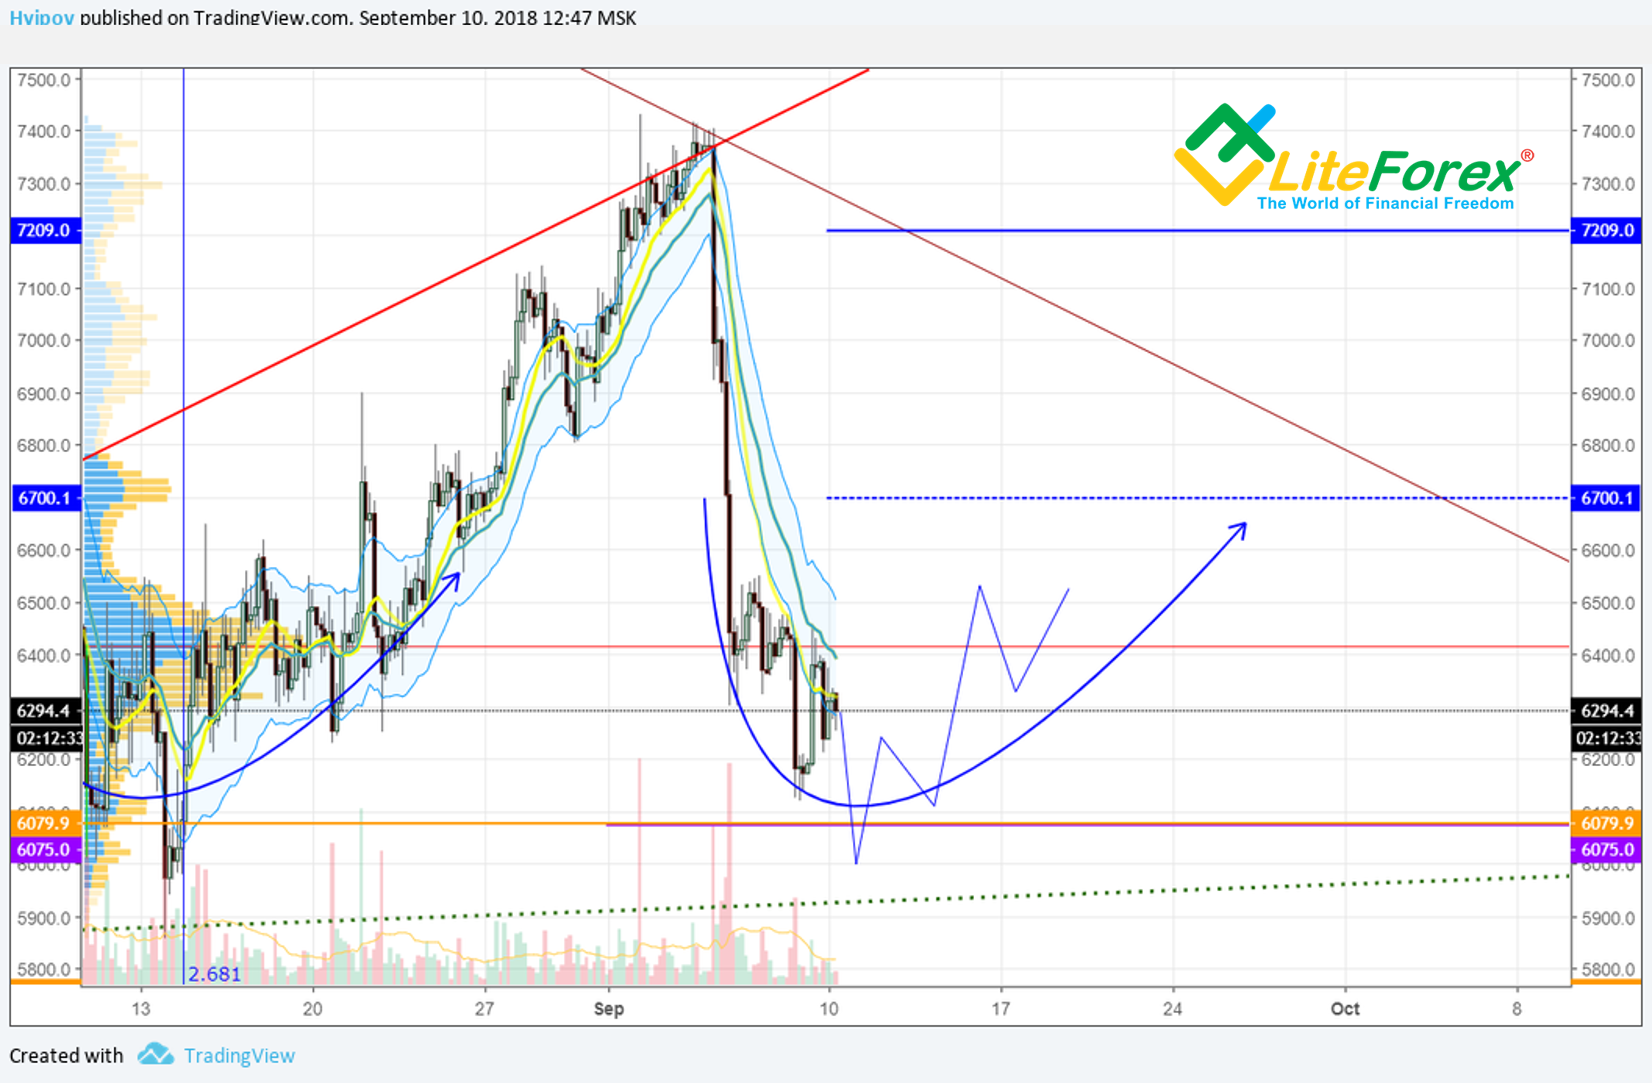
(BTC/USD forecast dated 10.09.2018)
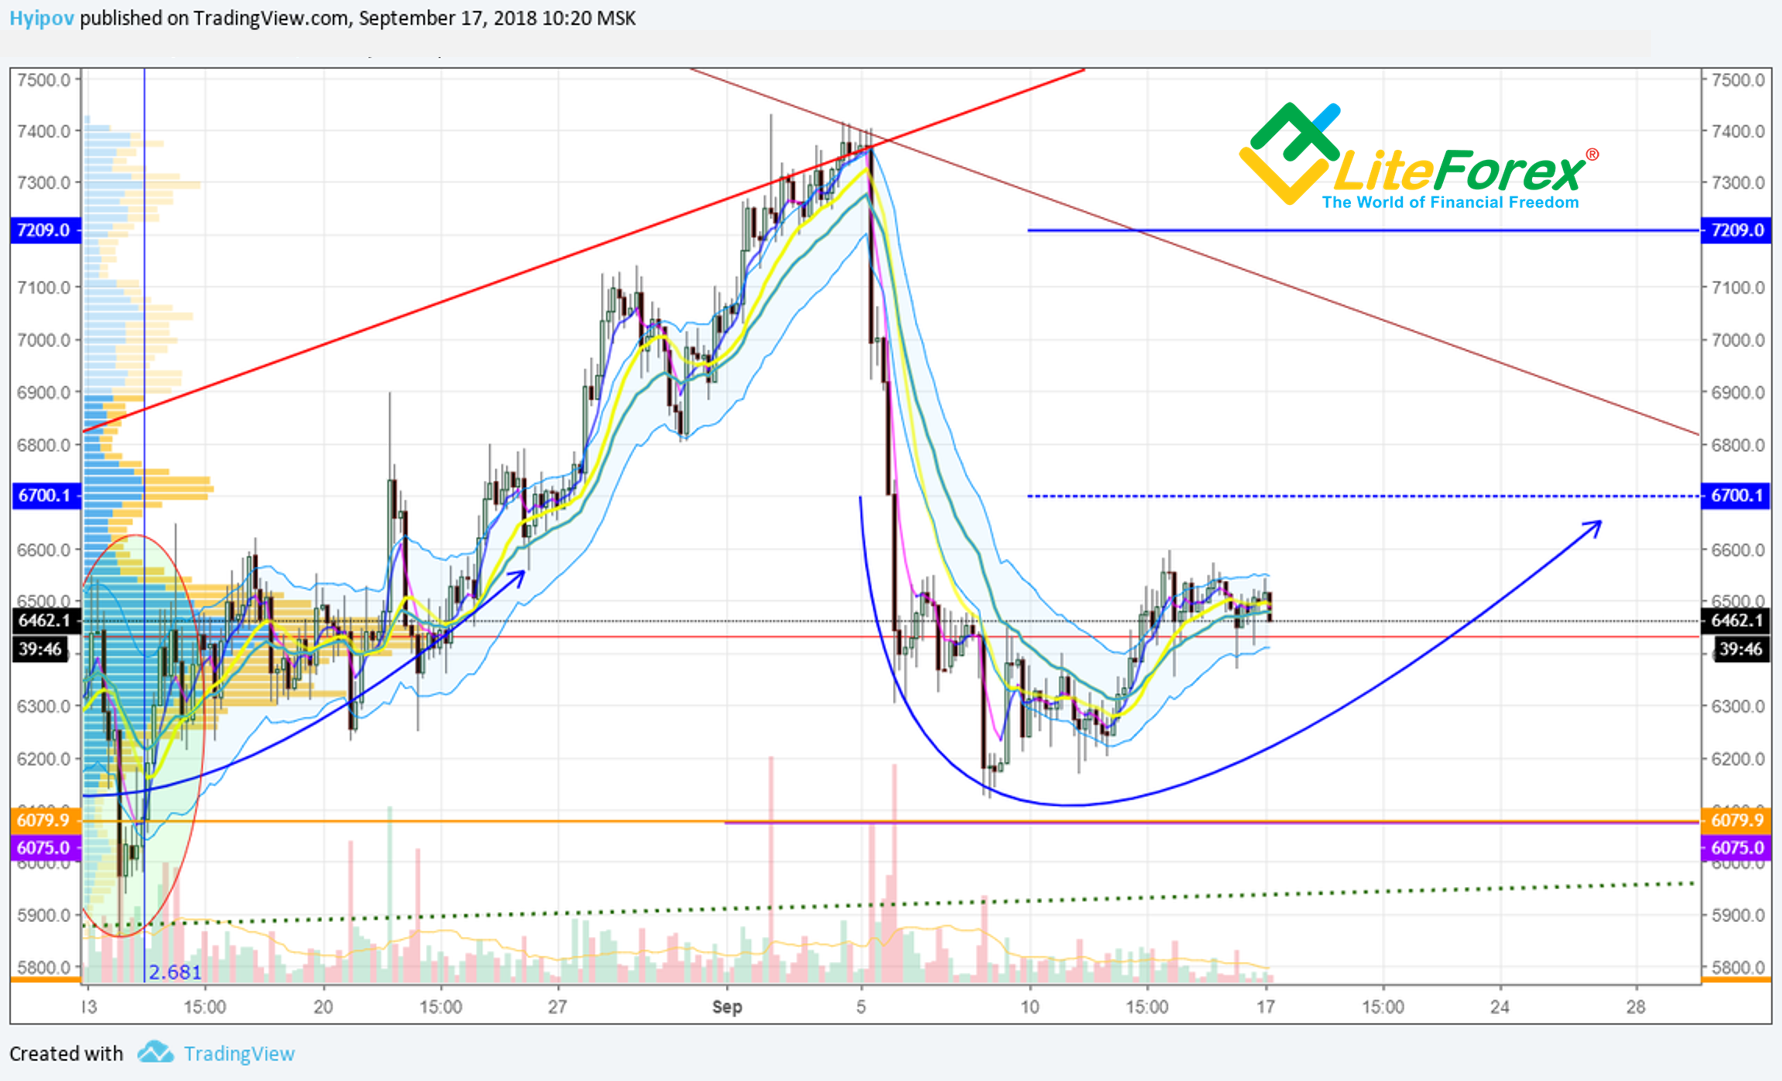
(Bitcoin actual situation; Bitcoin price to US dollar on 17.09.2018)
If you compare these two Bitcoin charts, you’ll see that, in general, the ticker is moving according to the suggested scenario. The only difference is that, despite the BTC expected price, BTC/USD didn’t test the key support levels and continued trading flat, having rebounded from the resistance at 6600 USD.
Let’s see, what effect this deviation can have on the Bitcoin future scenario.BTC/USD Fundamental Analysis
In terms of fundamental analysis, the recent week wasn’t very rich in the events.
One of the most remarkable news bits may be some inside information about Morgan Stanley (NYSE:MS) that is reportedly preparing to offer Bitcoin swap trading.
Unfortunately, Bloomberg refers to some unknown sources, so the information can’t be checked. However, on September, 13, when the news was released, Bitcoin rate responded and went slightly up from its support levels at 6400 USD.
Another important thing that means the change in the market sentiment was that many famous media people were claiming that that burst crypto bubble had passed its low and would retrace. The founder of Galaxy Digital, a cryptocurrency bank, Michael Edward Novogratz wrote about this on his twitter on September, 9. The day before, a Bloomberg observer, Michael Patterson, compares the crypto plunge with the Dot-Com crash. He writes the present Crypto collapse has exceeded the dot-com crash by 2% (cryptocurrency dropped by 80%, compared to the 78% decline in the stocks after the dot-com bubble burst). The information also suggests that the low is over there and it is the right time to think about purchases).BTC/USD Technical Analysis
To apply the information, suggested by the BTC fundamental analysis, to the BTC/USD price in future, I’ll carry out BTC/USD all-round market view.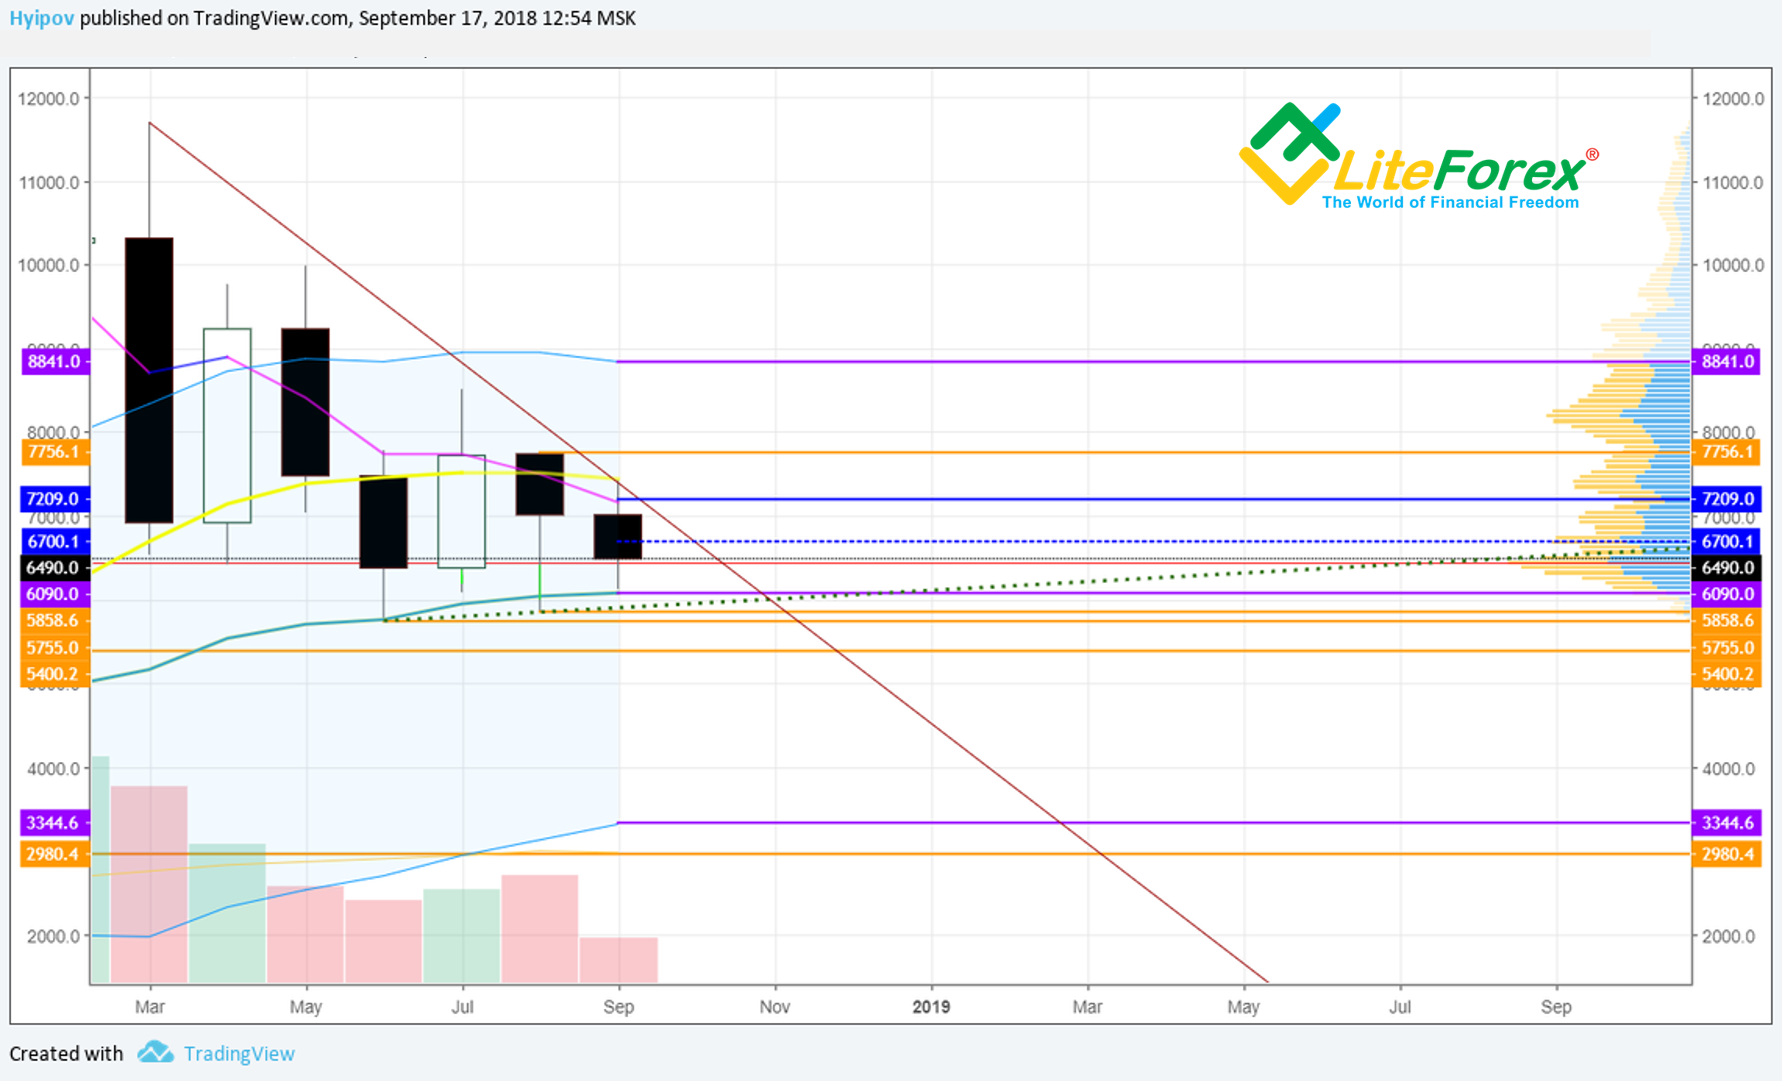
In the Bitcoin monthly chart above, you see that BTC USD, in the last candlestick, touched Keltenr channel’s centre line, rebounded and stopped at level 6500 USD.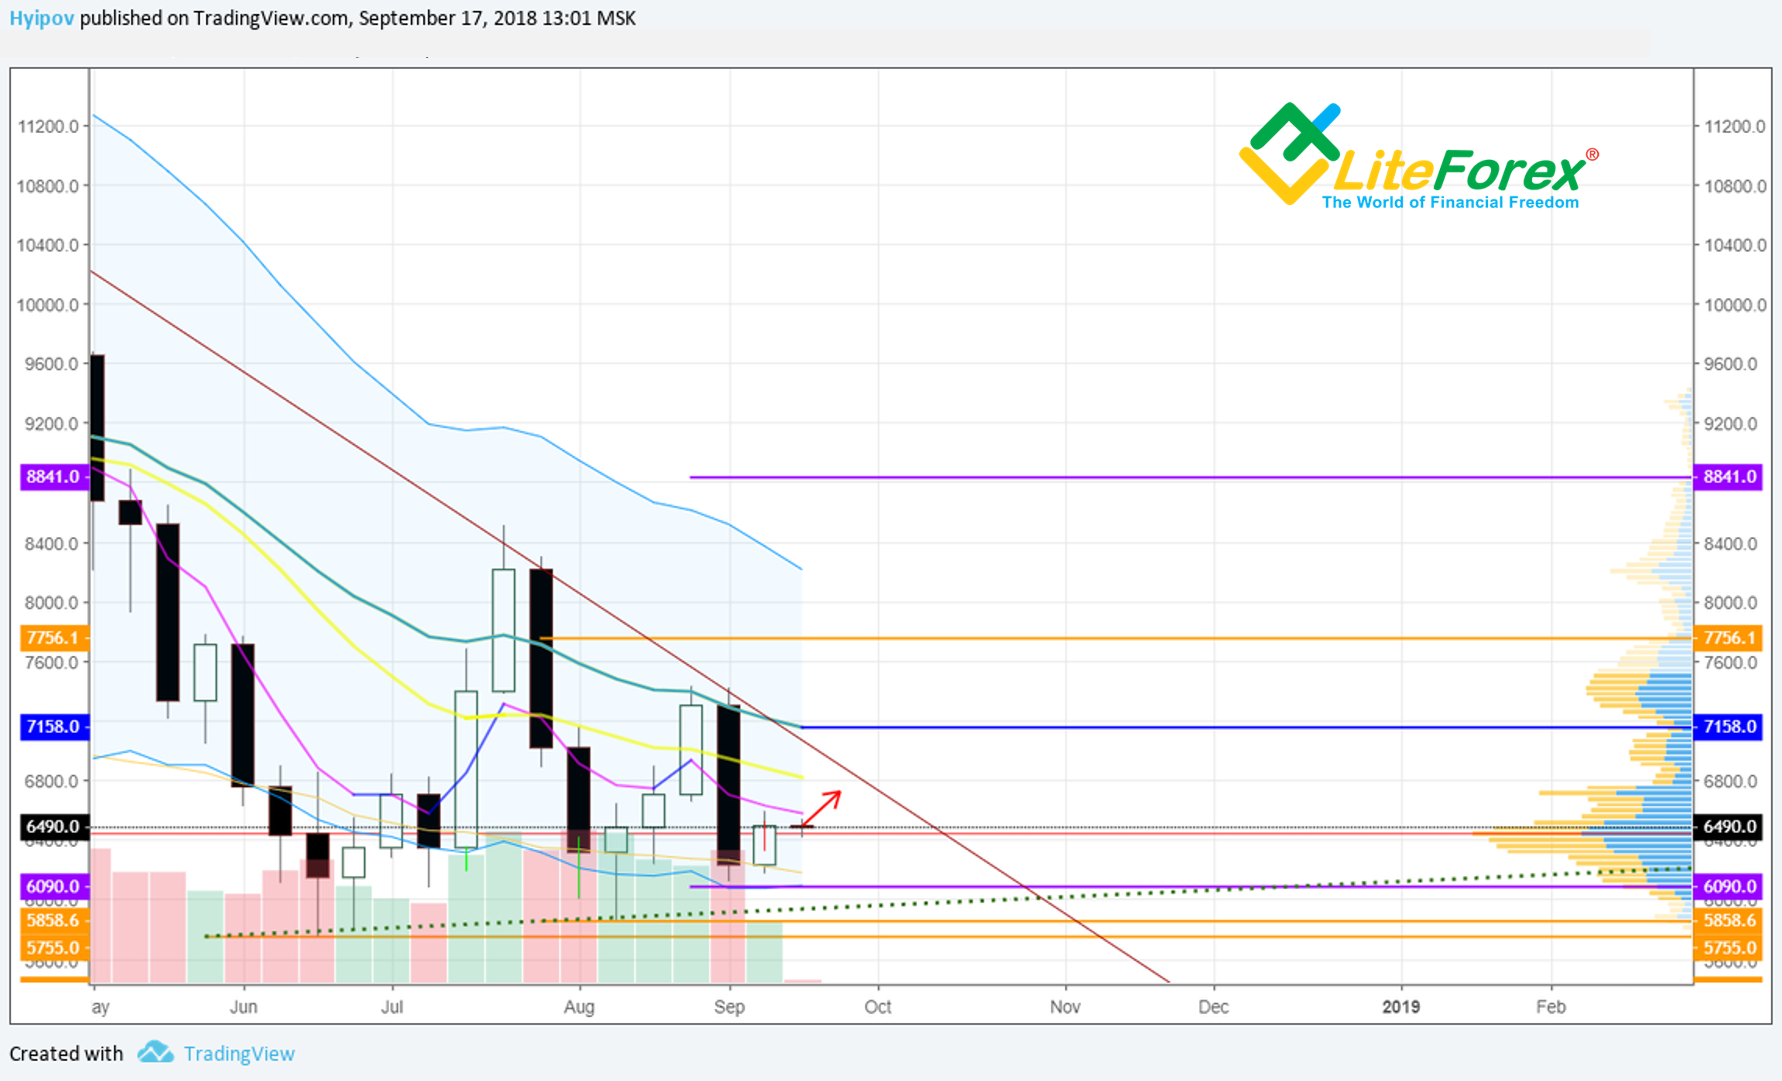
In BTC/USD weekly chart above, it is clear that the BTC price rebounded from the support levels at around 6090 USD. Besides, it is clear from the Bitcoin price chart that the downward trendline hinders the movement, limiting the growth at about 6090 USD – 6800 USD.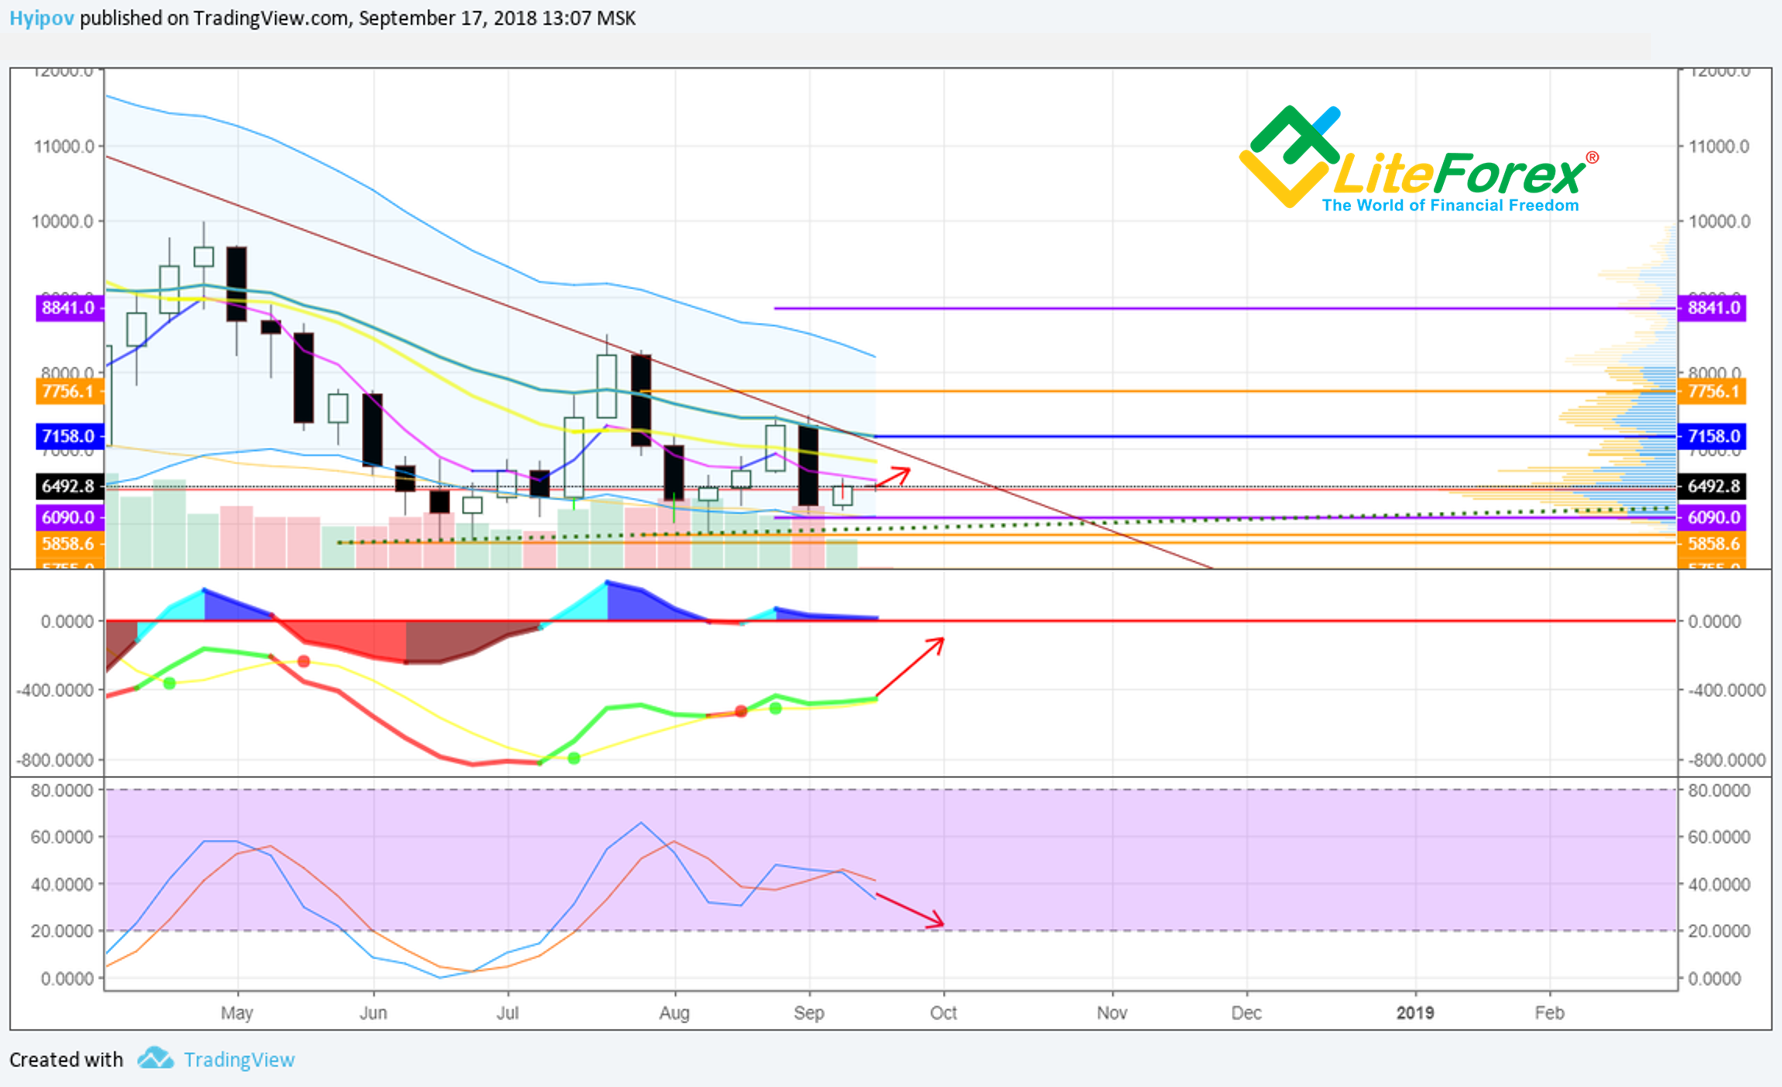
According to the oscillators in the weekly chart, the signals are oppositely directed. MACD is in the green zone, pointing up. RSI stochastic is in the channel’s centre; however, it is directed downwards. All this suggests the market uncertainty. However, the graph-bar of MACD technical indicator is in the positive zone and isn’t yet going to cross the zero level from above.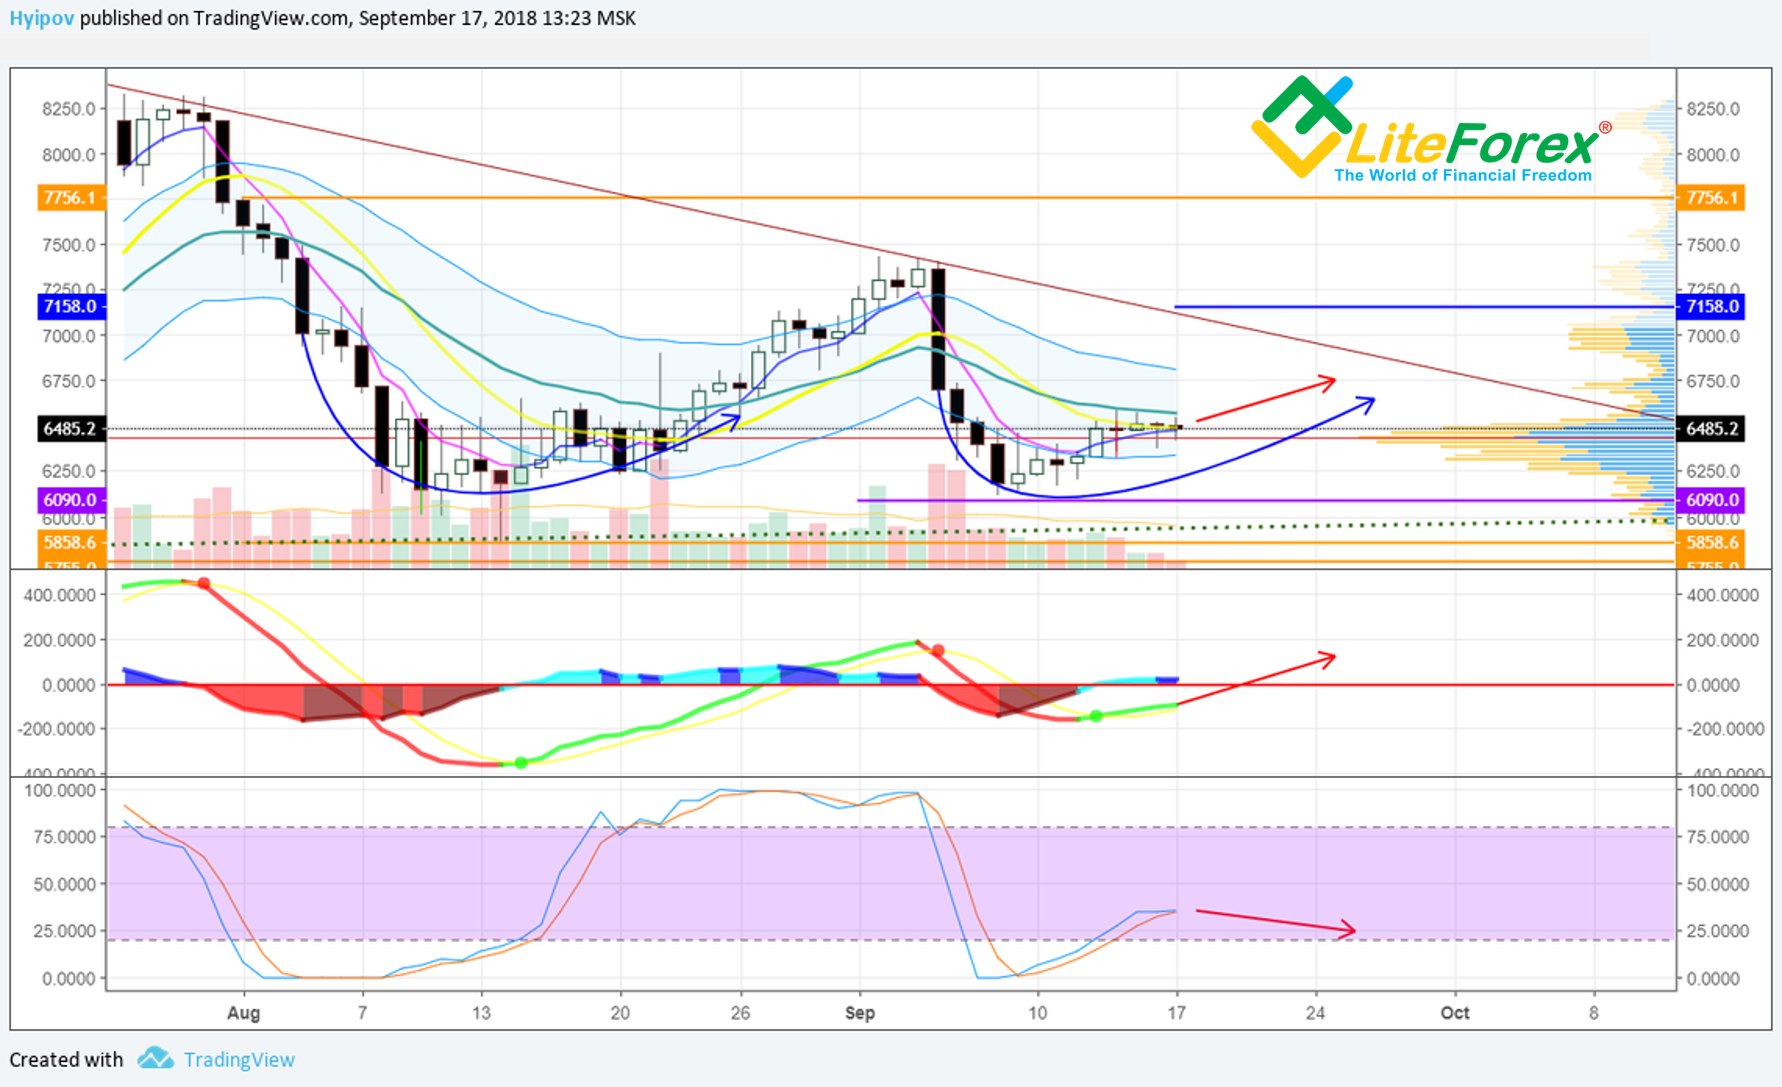
In the BTC/USD daily chart, it is clear that the ticker has consolidated above the point of control, indicated by the volume profile (marked with the red line). The BTC can’t yet move higher than the line, but it isn’t going below it. It means that the price is supported by buyers at the current levels.
However, the oscillators aren’t sending any clear bullish signals, wich doesn’t suggest long-term or middle-term investing.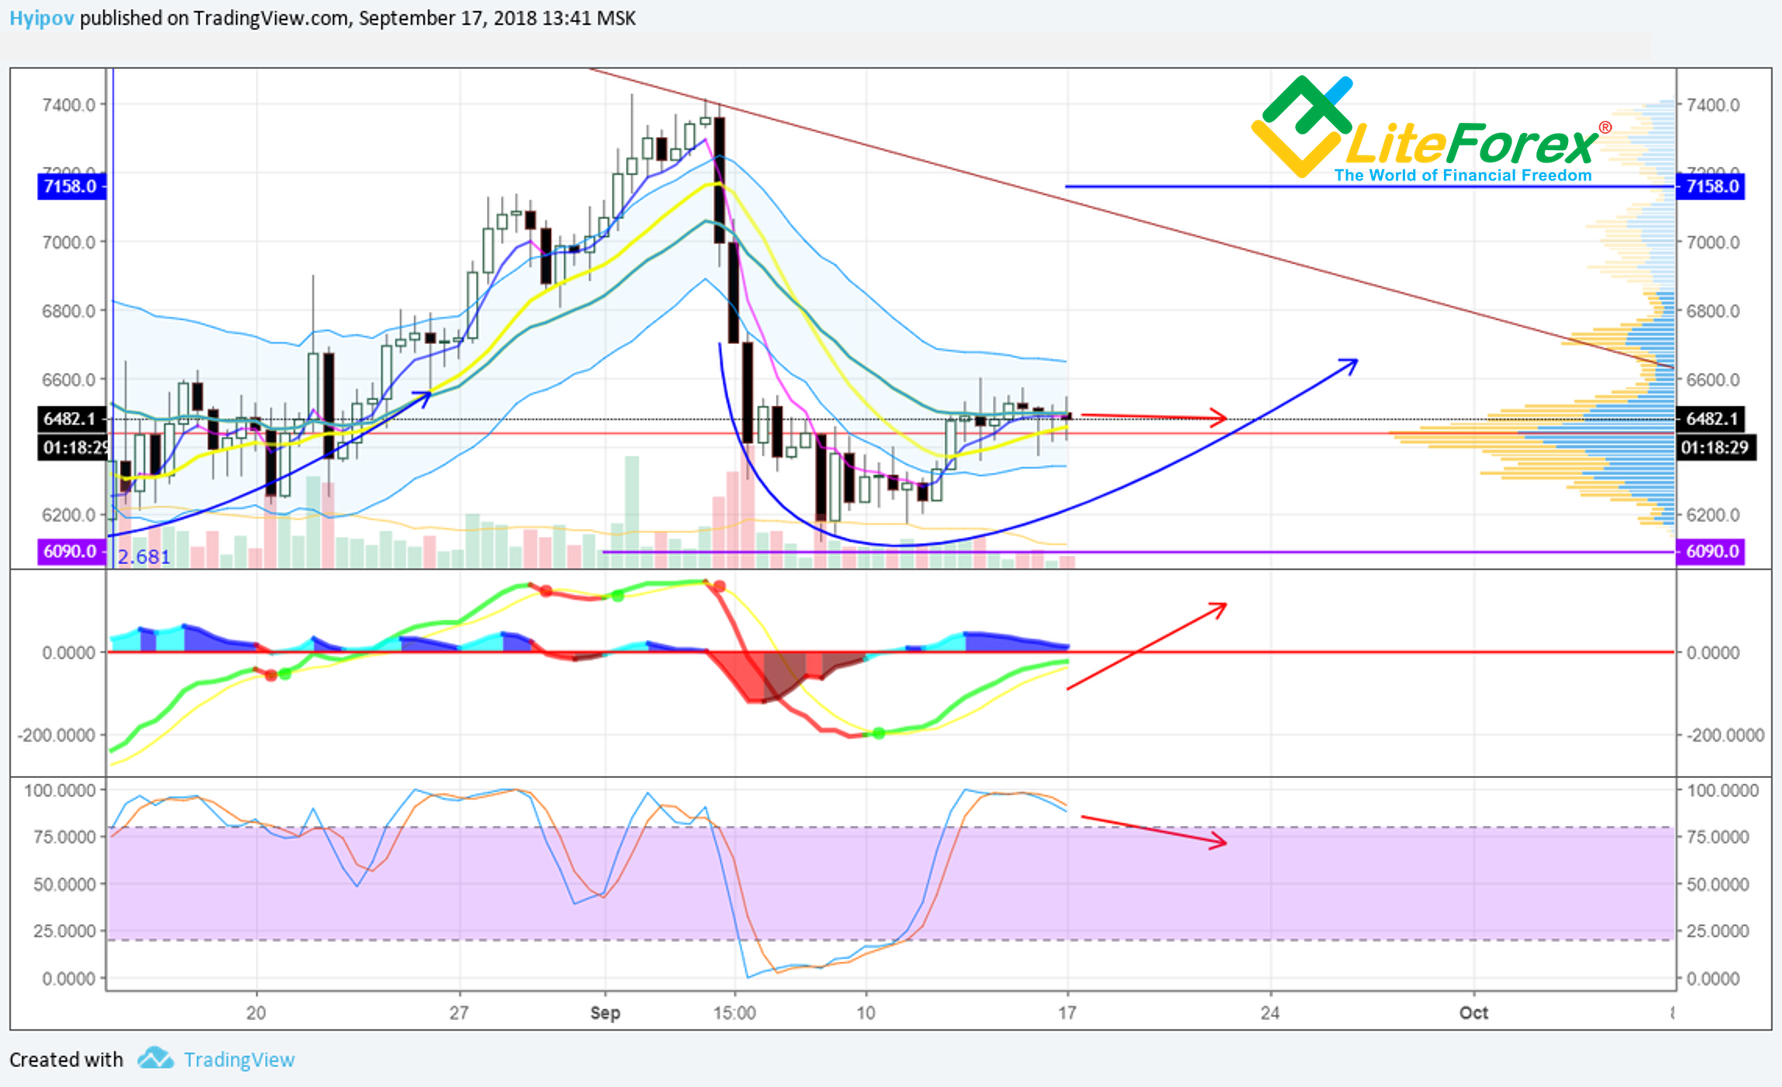
In BTC/USD 12H chart, it seems far more bearish. First of all, it is indicated by RSI stochastic that is in the overbought zone and is already directed downward; it is also indicated by MACD, whose moving averages are below zero level, but are already getting closer.
As a part of my big experiment, I suggest analyzing all studied graphic patterns.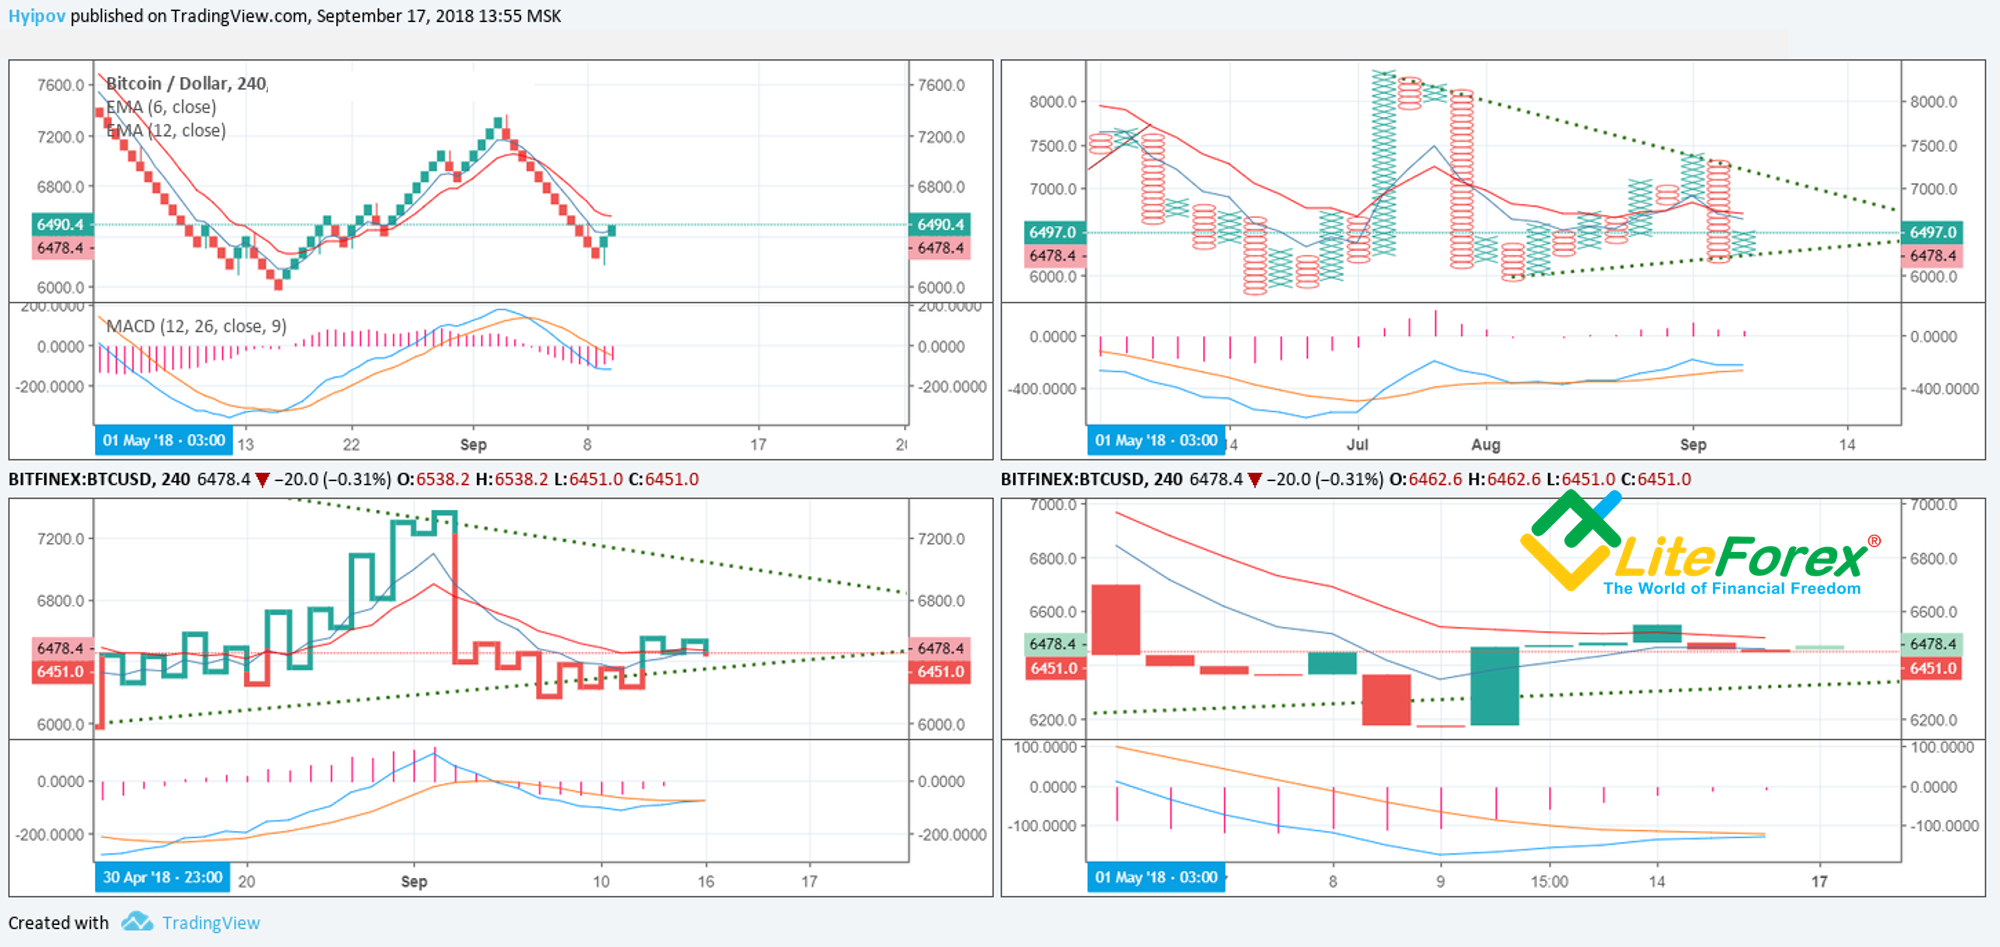
There is Renko chart in the top left corner. It is painting a bullish retracement wave inside the bearish trend. Moving averages and the MACD are still in the bearish zone. Therefore, the correction will hardly develop into the BTC trend reversal.
The Tic-Tac-Toe chart is in the top right corner. It is clear that there is emerging a symmetric triangle pattern in the chart; the BTC/USD ticker is now rebounding from the triangle’s bottom leg.
Moving averages are sending sell signal. MACD is sending a buy signal.
In the bottom left corner, there is Kagi chart. According to it, the ticker has passed through the level of shoulders and is green now, which is a positive sign. However, it is clear that the bullish retracement is about to breakdown and the ticker is going to pass through the level of shoulders from above and enter the red zone again.
Indicators in the chart are neutral, without any clear signals to buy or sell.
And, finally, there is Line Break chart. There is a clear sideways trend, indicate by very narrow lines. As a rule, there are hardly ever more than 6-7 similar lines in the BTC/USD chart. The sixth one is being constructed now, which suggests a soon potential momentum.
In addition, all indicators, like in Kagi chart, are in the sideways trend.Updated BTC/USD price forecast and BTC/USD trading scenario:
I have a feeling that someone is deliberately warming up the audience by announcements about the end of crypto fall and a new crypto surge.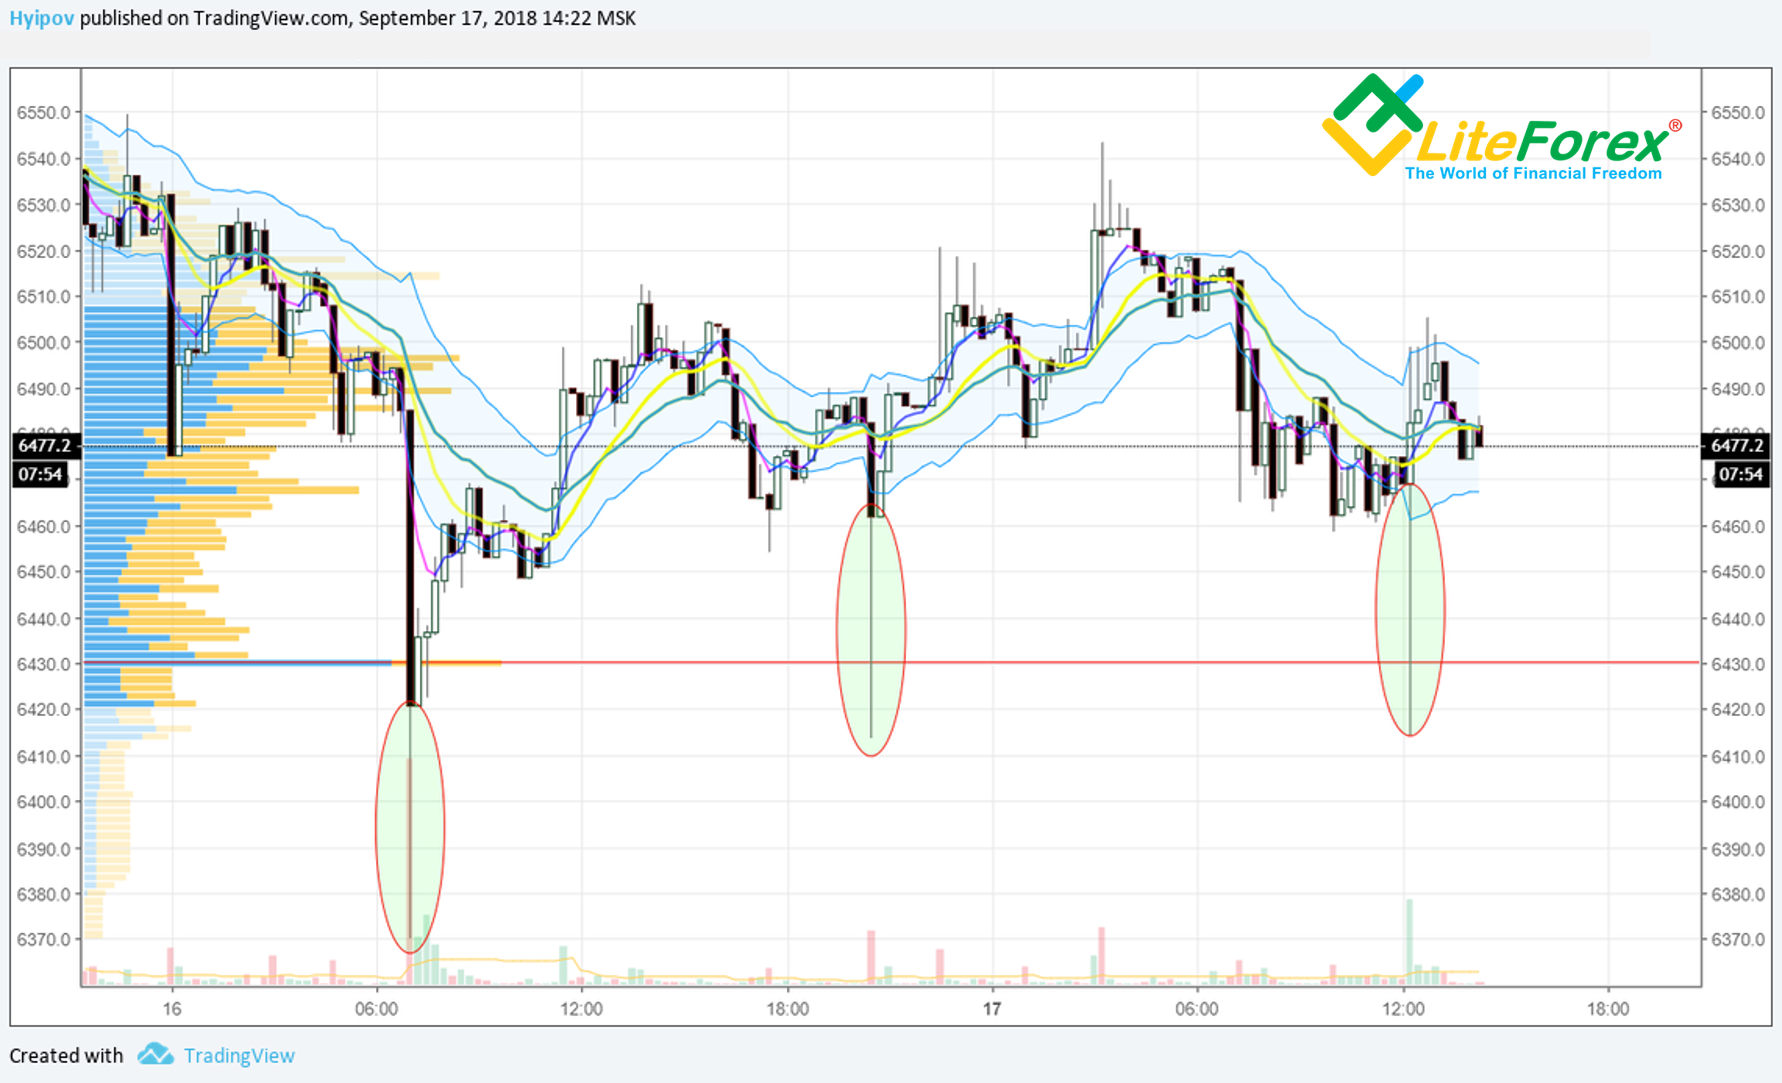
Besides, if you look at the BTC/USD 15M chart, you’ll see that, large traders are dumping their bitcoins to poor hamsters with almost equal intervals
As known, big traders always win in the end, and so, those who are buying now will soon be again nervous about sliding down market.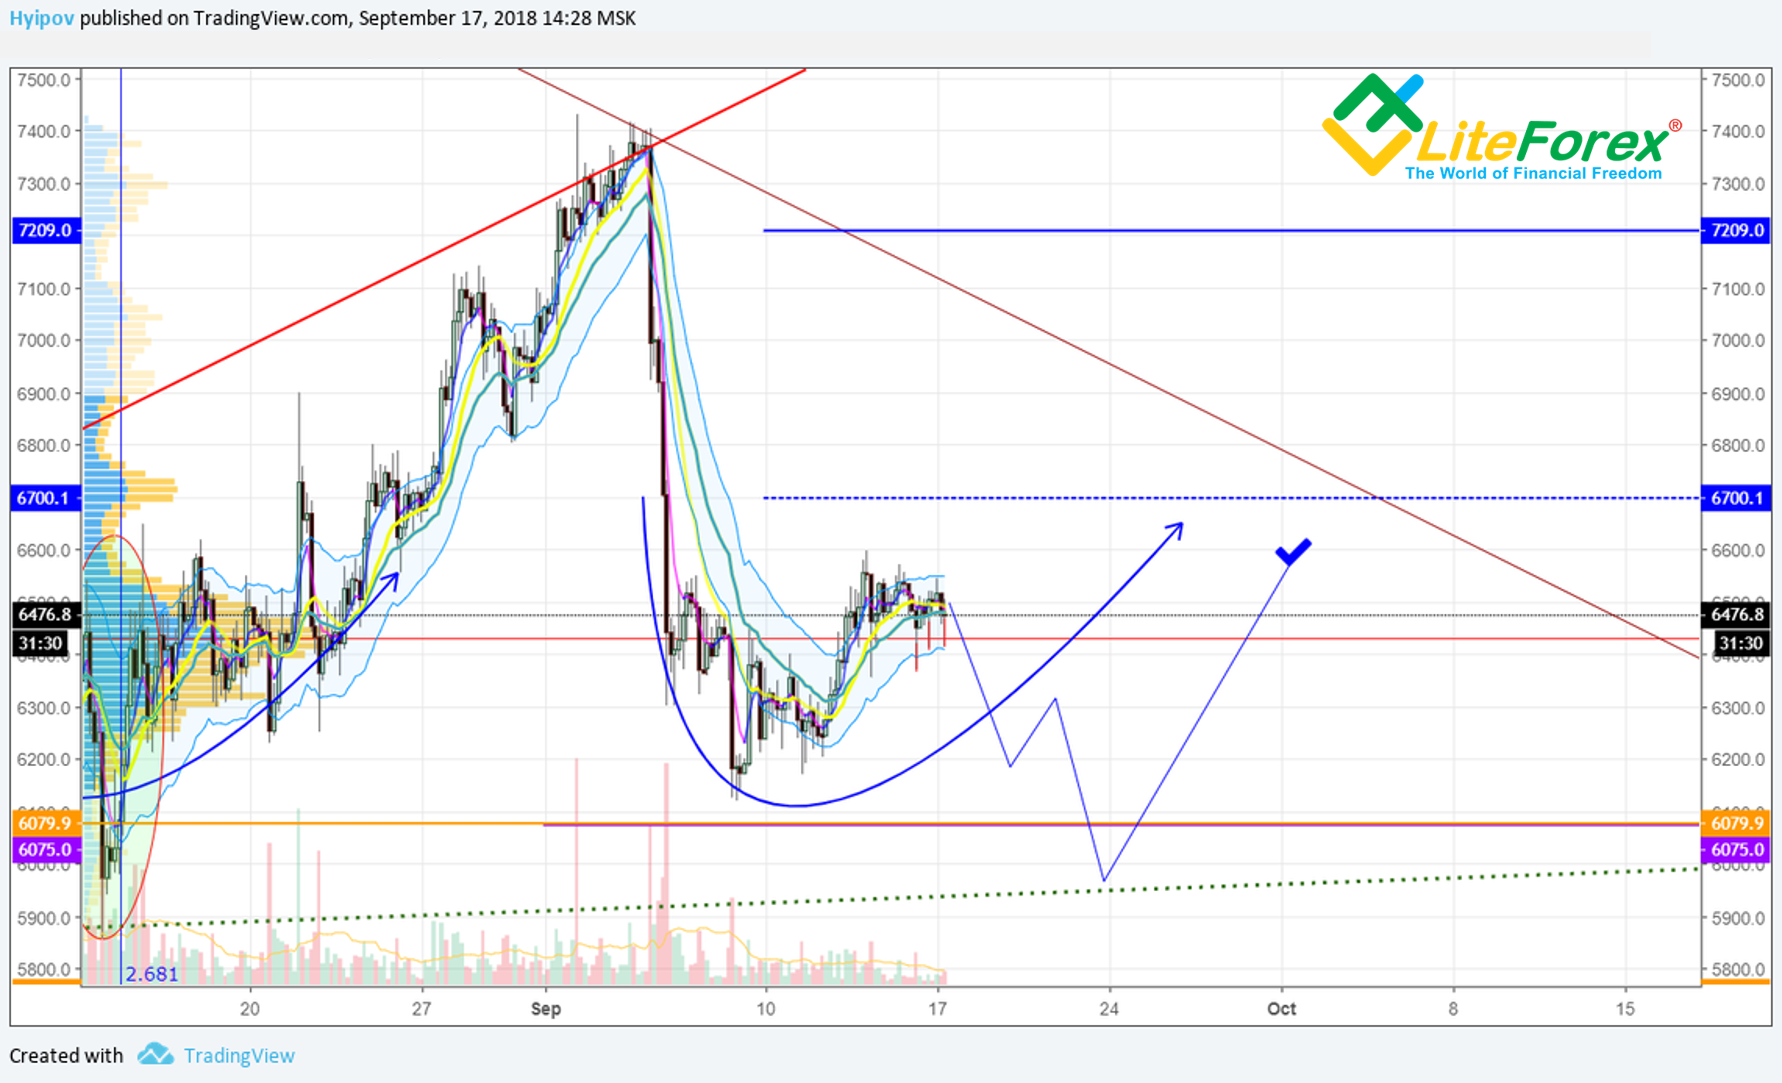
Taking into account all the above, the BTC/USD most likely scenario suggests that it will test the lows once again and try to reach the triangle’s bottom leg.
The scenario will be canceled only in case the BTC price is pushed up by a strong momentum and breaks through the descending trendline, going higher than the last local high at 7429 USD.