
Cryptocurrency breaks worst records
Review forecast for the cryptocurrencies: Bitcoin, Ethereum, Ripple and Bitcoin Cash fork
Forecast for BTCUSD, ETHBTC, XRPBTC, BCH(ABC)BTC for the next few month. In this post I applied the following tools: fundamental analysis, all-round market view, market balance level, volume profile, graphic analysis, trendline analysis, Japanese candlesticks, the Kagi chart, the Tic-Tac-Toe chart
Due to some changes in my working schedule, I revised the format of my daily crypto forecasts. Now, they will be posted not daily, but weekly. However, I’ll still perform fundamental analysis, and, in addition to the crypto benchmark, Bitcoin, I’ll write my forecasts for other altcoins as well. To keep up with the principle of all-round market analysis, I will start each first forecast for the new month with the analysis of the monthly and weekly charts; and each next one during the week will describe the analysis of daily and hourly charts. This way, I can write a full-scale forecast for multiple coins, retaining the quality of the analysis.
As usual, I’ll traditionally start with fundamental analysis.
Fundamental analysis
Despite the panic, flooding the cryptocurrency market, I haven’t found any news in the crypto media, which could explain the turmoil and the fact that the strongest levels were broken out all at once.
Among all events during the recent week, especially negative are only two pieces of news. The first one, dated November 13, says that Chinese government conducts extensive tax inspection of mining farms. Because of this, cryptocurrency mining operations in the Chinese provinces of Xinjiang and Guizhou were suspended as power to the mining farms was shut off. According to CNN, it is still unknown whether the electricity supply has been resumed or not.
The article itself is very strange and looks like the information stuffing. The inspection has been carried out since November 5, but the power was cut off only recently. In this situation, I don’t see any reasons for panic. It is not about a total ban or something like that. The article only deals with legalizing the market and cryptocurrency operations, which in the long run should be beneficial for the crypto market.
Another important event is the division of Bitcoin Cash into Bitcoin ABC and Bitcoin SV. The hardfork took place on November 15, which also doesn’t correspond to the crash, occurred on November 14. In addition, it is not clear how this event relates to the Bitcoin rate. Basically, this event should have a negative impact on Bitcoin Cash itself, as due to the scandal, this asset has lost a great deal of its credibility. Based on the assumption that Bitcoin Cash is a direct rival for Bitcoin, if the first one is weak, the latter should get a chance to gain the lost positions back. Therefore, the news bit can’t have a negative influence on the Bitcoin rate.
Neither of these events looks convincing. If you look at the Bitcoin 15-minute chart, you’ll see it clearer.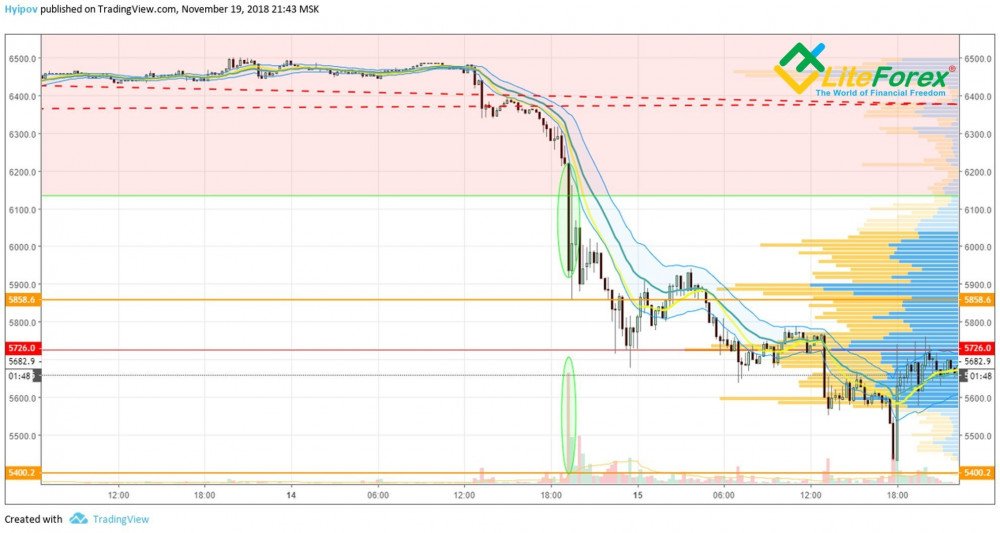
As it is clear from BTC/USD price chart above, the fatal triggering of stop losses and breaking through the eternal support level of 6000 USD was performed with incredible trade volumes. Obviously, the manipulators don’t even bother to create negative news background, they are just dumping the market down. In the environment of low trading volumes and general sluggishness of the crypto market, this method proves to be efficient. Without any informational support, the feelings of panic and uncertainty are only growing stronger. Scared hamsters start to give up on Bitcoin and the cryptocurrency in general, escaping the market with huge losses. The manipulators clearly aim at dropping the market as deep as possible, triggering all the stops. But even big traders need a break. So, the fall will surely be followed by the rise. Where is it to start? Let’s try to find out by means of technical analysis.
BTC/USD technical analysis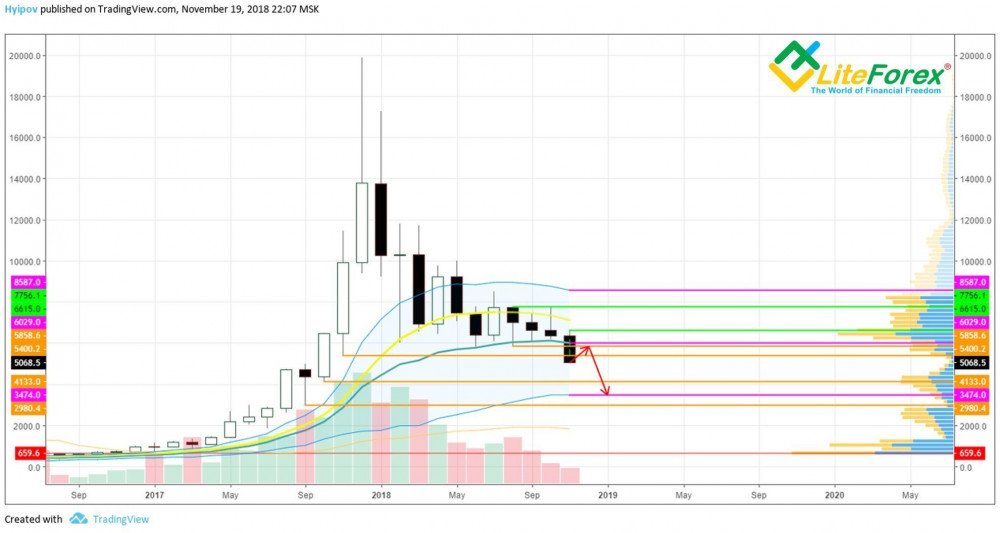
It is clear from Bitcoin price chart above that the last November candlestick has broken through all the key support levels. The next level that could be an obstacle for bears is at 4133 USD. But even this may not be the limit. You see that BTC/USD ticker has broken through Keltner channel’s middle line. Now, Bitcoin has only one way- down, towards the channel’s bottom border at 3474 USD. Bitcoin needs strong reasons for a sound growth; otherwise, buyers won’t believe in such movement. There could be only a single positive thing in this situation. As you see from the BTC chart above, the entire bearish trend is going down rather gradually and expectedly. If the following month is closed lower than the previous one, then, while the candlestick is forming, the ticker is corrected up at least by a half of the previous candlestick body. So, we may expect a bullish correction towards 5800 USD– 6000 USD next month.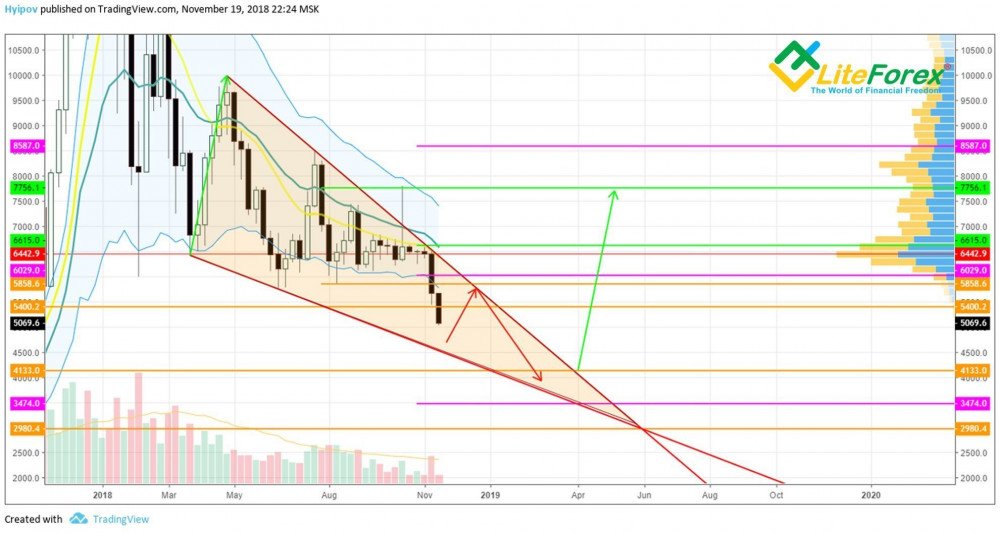
As you see in the weekly BTC/USD price chart, the breakout of level 6000 USD has turned the triangle into a falling wedge. I don’t think that Bitcoin price will crash down to 3500, even taking into consideration the recent sharp drop. You see that the figure bottom leg is already at 4500 – 4600; it should provide the support. If the price rebounds, the pattern top border is at about 5800 USD – 6000 USD. So, in general, the situation corresponds to what has been suggested before. In late November, there is most likely to be a corrective wave from 4600 USD – 4800 USD up to 5800 USD– 6000 USD. In late December, Bitcoin is most likely to continue sliding from 6000 USD down to 4100 USD– 3500 USD. Next, it should come to exiting the pattern, the upside breakout, where the target may be at about 7750 USD; but that is rather about the middle of 2019, so I’ll be revising the scenario.
ETH/BTC technical analysis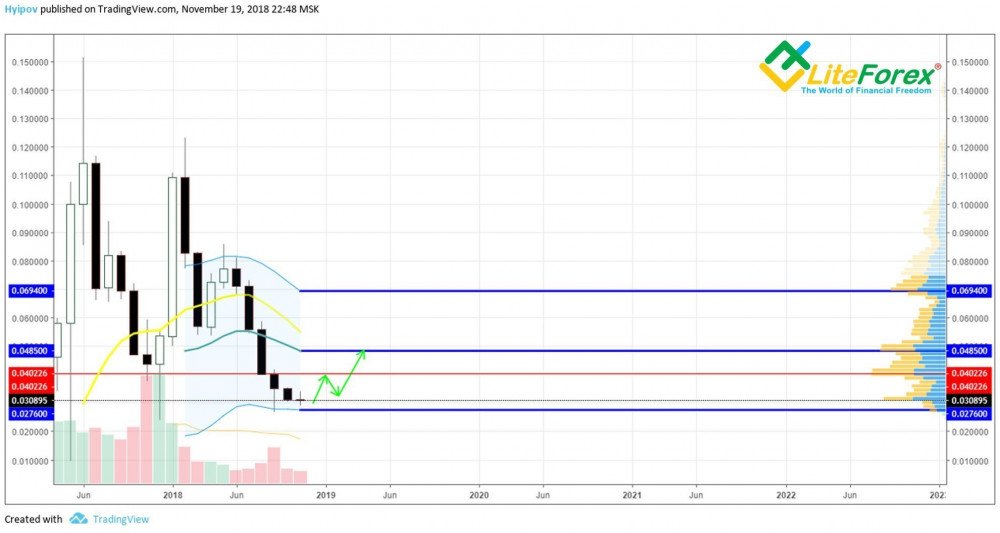
Based on the scenario, suggested for Bitcoin trend, Ethereum has all the chances to perform better than the rest of the crypto market. As you see from ETH/BTC price chart above, the ticker has already hit the channel’s bottom border, and so, the next target for the instrument is Keltner channel’s middle line. Like Bitcoin, ETH/BTC is likely to start bullish correction in early December and may continue rising up to the point of control in volume profile, at about 0.040226 BTC. Next, following Bitcoin, Ethereum should be corrected downwards, but will hardly reach the previous low and go up towards 0.0485 BTC.
XRP/BTC technical analysis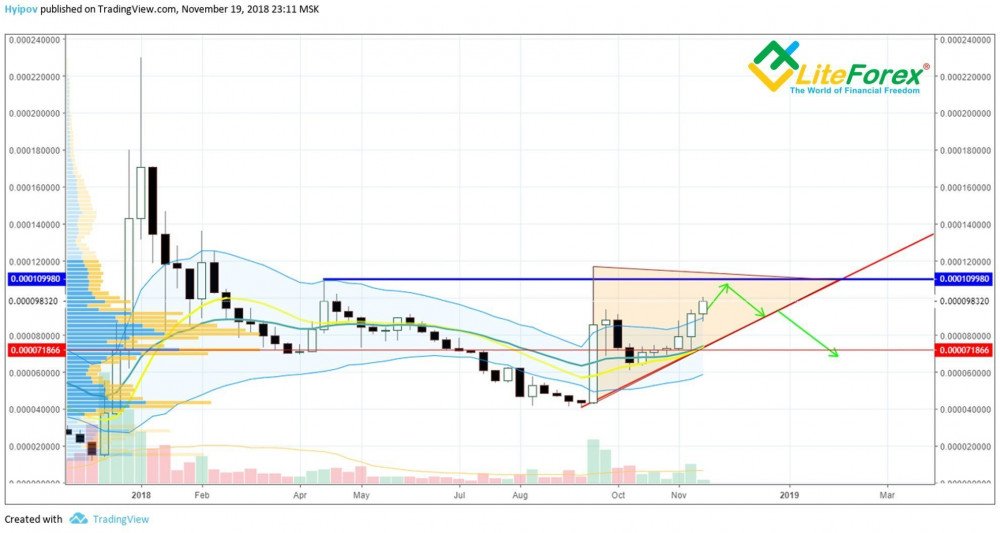
Based on the weekly chart above, the XRP/BTC ticker is moving against the market and is growing now. Ripple is bought at low volumes, so it is too early to suggest a continuous uptrend. Ripple price has already reached Keltner channel’s centre line, so it faces a strong resistance to move higher. The peak of the bullish wave is at about 0.00010 BTC -0.00011 BTC. It should be reached in late November. According to Bitcoin scenario, the next downward wave should affect XRP as well. The ticker is highly likely to break through the triangle and reach the point of control of the volume profile.
BCH(ABC)BTC technical analysis
The worst by now is the performance of Roger Ver’s creation.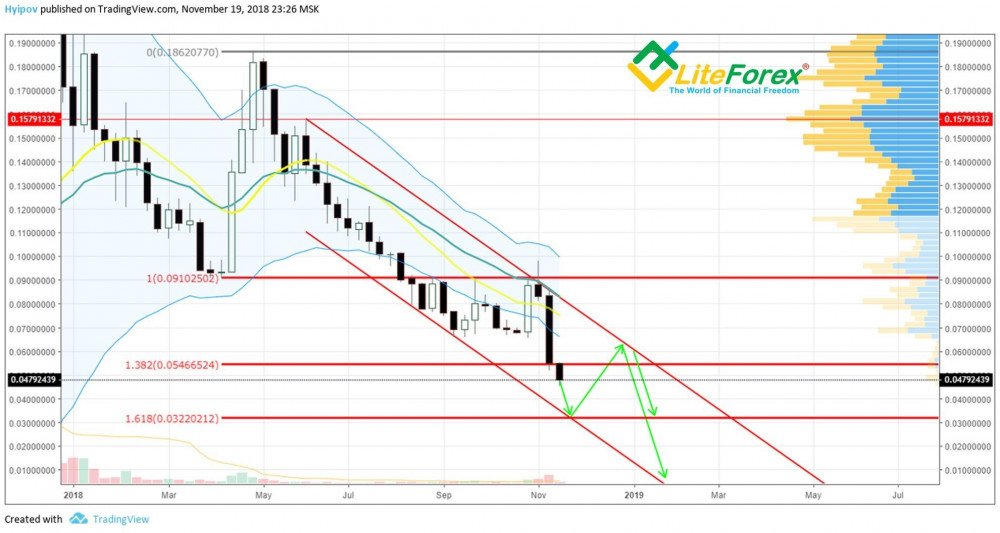
As you see from the weekly BCH price chart above, the BCH/BTC ticker has broken out all possible support levels and is now falling into an abyss. The support level, according to 1.618 Fibonacci extension from the reverse of the last growth wave, is at 0.032 BTC. That is where I expect BCH to be by the end of November. Next, according to the general cryptocurrency scenario, it should rebound to the channel’s top border at about 0.060 BTC. Where from, following Bitcoin, BCH will slide down, with a likely breakout of the lows.
This altcoin is in a very difficult situation now, as it isn’t yet clear that it will BCH(ABC), which is to be recognized as the true Bitcoin Cash. Ironically, Roger Ver, the man who has been trying to convince everybody that his creation is the true Bitcoin, can soon start insisting that BCH(ABC) is the true Bitcoin Cash. We’ll see how that goes.