Get 40% Off
🚨 Volatile Markets? Find Hidden Gems for Serious OutperformanceFind Stocks Now

Brent Crude’s Moment Of Truth Looms

Published 09/15/2017, 06:30 AM
Updated 07/09/2023, 06:31 AM

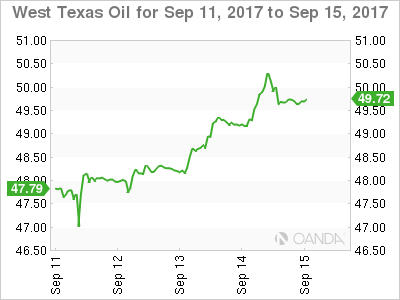
Exciting times for oil as we head towards the end of the week, with WTI rallying over 1.0% and Brent 0.5% as North Korea’s missile test iced the cake of a bullish technical picture for both contracts.

Late New York saw WTI spot spike through the $50.00 mark to touch $50.50 before falling back to a more sedate $49.85 in Asia mid-session trading. Brent scrambled to $56.10 before settling at a still respectively $55.70 during the Asia session. WTI’s move in particular, looked very stop loss driven as the $50.00 mark broke. But there shallowness of the pullback in both contracts can be seen as positive.

With the EIA upgrading oil consumption forecasts, U.S refining quickly recovering from hurricane induced shutdowns and OPEC suggesting inventories are falling, the picture has been one of good news this week for crude generally.

Brent

From a technical perspective Brent in particular though is approaching its moment of truth. It is now just one dollar away from the mega resistance region of 56.50/57.00 that has capped gains for all of 2017. Another failure here would imply a potentially deep correction could be on the cards, while a daily close above sets the stage for a test of 60.00 which would no doubt bring smiles to the faces of Saudi Aramco’s IPO team.

Longer term support is at 52.15 where Brent’s 200-day moving average and its Long-term trandline support meet today. In the bigger picture, Brent remains technically constructive above this level.
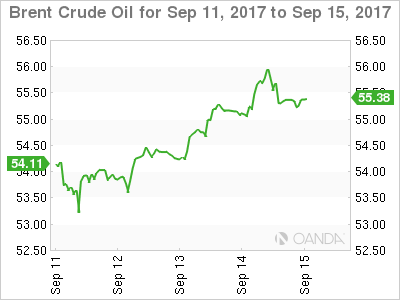
Brent Crude Oil Chart: September 11-15

WTI

WTI spot has broken out of its range between its 100 and 200-day moving averages but must close above the 50.00 mark to give bulls renewed energy. Initial resistance is at the overnight high at 50.50 followed by the May highs at 51.65. Critical support is at 49.30 today. This being a previous triple TOP and the 200-day day moving average.
3rd party Ad. Not an offer or recommendation by Investing.com. See disclosure here or remove ads .

West Texas Oil Chart: September 11-15

Original post

Latest comments

Risk Disclosure: Trading in financial instruments and/or cryptocurrencies involves high risks including the risk of losing some, or all, of your investment amount, and may not be suitable for all investors. Prices of cryptocurrencies are extremely volatile and may be affected by external factors such as financial, regulatory or political events. Trading on margin increases the financial risks.
Before deciding to trade in financial instrument or cryptocurrencies you should be fully informed of the risks and costs associated with trading the financial markets, carefully consider your investment objectives, level of experience, and risk appetite, and seek professional advice where needed.
Fusion Media would like to remind you that the data contained in this website is not necessarily real-time nor accurate. The data and prices on the website are not necessarily provided by any market or exchange, but may be provided by market makers, and so prices may not be accurate and may differ from the actual price at any given market, meaning prices are indicative and not appropriate for trading purposes. Fusion Media and any provider of the data contained in this website will not accept liability for any loss or damage as a result of your trading, or your reliance on the information contained within this website.
It is prohibited to use, store, reproduce, display, modify, transmit or distribute the data contained in this website without the explicit prior written permission of Fusion Media and/or the data provider. All intellectual property rights are reserved by the providers and/or the exchange providing the data contained in this website.
Fusion Media may be compensated by the advertisers that appear on the website, based on your interaction with the advertisements or advertisers.
© 2007-2024 - Fusion Media Limited. All Rights Reserved.