Our proprietary price modeling systems are showing us that our expected price basing, which we have been warning our members against for nearly 3 months, has altered in range and scope. What we did expect to happen near February 21 is now expected to start sometime between February 21 and February 26. In other words, we are warning our clients that a moderate downside move is expected in the US indices through most of this week, ending near the end of February, before a strong rally in prices is likely to begin.
At TheTechnicalTraders, we are constantly using our proprietary price modeling systems and price cycling systems to determine when and where the next trading opportunity will happen. We’ve posted a number of research reports to the public to assist all traders and investors throughout this year. We called the early rally in the US majors weeks before it started. We called the correction months before it happened. We called the bottom in this volatile rotation and told all our members that we believed prices would accelerate higher after a tight pennant formation completed.
Now, we are warning our members to prepare for a mild to moderate downward price rotation to an extended 3~5 day basing pattern near Feb 25 through Feb 27. This basing pattern should be a perfect opportunity for intermediate-term swing traders to initiate and setup trades headed into the March 15 price peak we have been telling you about.
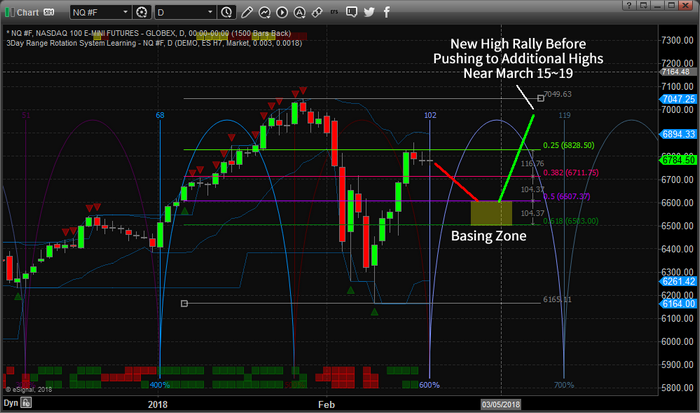
This NASDAQ 100 chart clearly shows the markets have sufficiently retraced (in this case nearly 75%) and have stalled. This move aligned perfectly with our cycle definitions and our projected higher price activity. Now, our proprietary Adaptive Dynamic Learning (ADL) modeling system is telling us the BASING ZONE is likely to happen near the end of February – not near the February 21 date we saw earlier in the year. So, we are altering our scope of analysis to address this change by telling readers to expect a downward price move over the next 5~7 days into the BASING ZONE before the next leg of a rally begins.

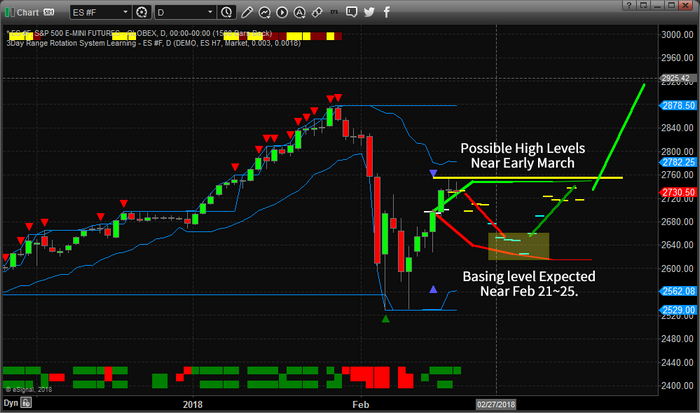
This ES chart presents a similar picture and shows our ADL system at work. You can see from the DASH markers on the chart where the ADL system is predicting prices to be into the future. We have determined that the $6500~6600 level of the NQ and the $2600~2650 level of the ES are key BASING target levels. From these levels, we expect the US majors to attempt a rally to recent highs first, pausing briefly, before breaking higher to attempt a fresh run at new highs.

This move should excite traders and investors. It means this recent volatility rotation provided a healthy “washout” of low volatility positions and the real price action can now begin in earnest. This is a classic setup for most technicians. A washout rotation setting up a potential double top pattern (acting like resistance) before a breakout move drives higher prices. All the while, setting up the short (with the double top formation) in a manner that will bait them into positions before the squeeze happens.
