
Shares of Under Armour (NYSE:UAA) surged nearly 7% Tuesday after the company surpassed fourth-quarter earnings and revenue estimates. Now let’s break down the sportswear company’s Q4 results and see what might be next for Under Armour stock.
Q4 Overview
Under Armour posted adjusted fourth-quarter earnings of $0.09 a share, which topped our $0.04 Zacks Consensus Estimate. The company’s overall Q4 revenues climbed 1.5% to reach $1.39 billion and come in just above our $1.38 billion estimate. This, however, marked UA’s slowest top-line growth of 2018. For the full-year 2018, Under Armour saw its revenues pop 4% to reach $5.19 billion.
More specifically, Under Armour’s North American sales dropped 6% from the year-ago period to $965 million. Investors need to pay close attention to this segment because it is still by far the sports apparel firm’s largest unit, accounting for approximately 70% of total sales. This downturn also comes on top of the year-ago period’s 4.5% downturn in North American.
Meanwhile, footwear sales fell 4% and direct-to-consumer revenue came in flat. On the positive side, UA’s international sales soared 24% to touch $395 million—with EMEA and Asia Pacific more than making up for a decline in Latin America—and account for 28% of total revenue, up from 24% of company sales in Q3. Plus, apparel sales popped 2% to $970.4 million.
Shares of UAA jumped 6.88% to reach $22.21 Tuesday, which helped them inch closer to their 52-week high of $24.96 per share.
Outlook
Under Armour executives maintained their fiscal 2019 top-line growth outlook of 3% to 4%, which they revised in December. The company also expects to see low double-digit growth in its international business and flat North America sales.
Investors might be disappointed by Under Armour’s international outlook after it posted a 23% expansion in the full-year 2018. Maybe more importantly, the company has now reported year over year sales declines in North America in five out of the last six quarters.
Under Armour has been restructuring its operations to cut spending, inventories, and streamline its product offerings, among other initiatives, since the summer of 2017. The Baltimore-based company recognized $204 million in restructuring costs in 2018, after it called for between $200 and $220 million.
The sportswear firm has struggled in North America as rivals Nike (NYSE:NKE) and Adidas (DE:ADSGN) AG (OTC:ADDYY) report solid growth. In fact, Nike’s North America sales surged 9% last quarter. Meanwhile, Lululemon (NASDAQ:LULU) and even some of Gap’s (NYSE:GPS) athletic brands have stolen some of Under Armour’s shine.
Under Armour’s rivals have succeeded in the still-expanding athleisure market as UA fails to gain traction. On top of that, UA’s direct-to-consumer revenues have hardly grown in the Amazon (NASDAQ:AMZN) age and its presence across social media platforms like Twitter (NYSE:TWTR) and Instagram (NASDAQ:FB) pale in comparison to some of its peers.
Bottom Line
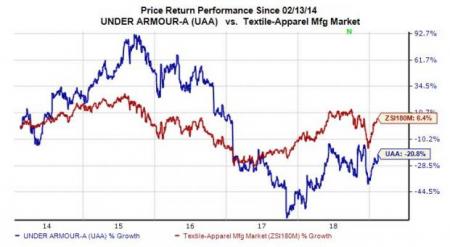
UAA stock is up over 33% in the last year, which blows away its industry’s 15% climb, despite its steady North American sales decline. Under Armour is also currently trading 58.9X forward 12-month Zacks Consensus EPS estimates, which marks a massive premium compared to its industry’s 17.3X average and Nike’s 28.3X.
And let’s not forget that UAA stock popped Tuesday even though its guidance was hardly inspiring. Therefore, the average investor might want to stay away from UAA as it seems like it’s more of a trader’s stock at the moment.
Zacks' Best Stock-Picking Strategy
It's hard to believe, even for us at Zacks. But from 2000-2018, while the market gained +4.8% per year, our top stock-picking strategy averaged +54.3% per year.
How has that screen done lately? From 2017-2018, it sextupled the market's +15.8% gain with a soaring +98.3% return.
Free – See the Stocks It Turned Up for Today >>
Amazon.com, Inc. (AMZN): Get Free Report
Facebook, Inc. (FB): Get Free Report
Twitter, Inc. (TWTR): Free Stock Analysis Report
The Gap, Inc. (GPS): Get Free Report
lululemon athletica inc. (LULU): Get Free Report
NIKE, Inc. (NKE): Get Free Report
Adidas AG (ADDYY): Free Stock Analysis Report
Under Armour, Inc. (UAA): Free Stock Analysis Report
Original post
Zacks Investment Research