
BP plc (LON:BP) (NYSE:BP) reported fourth-quarter 2018 adjusted earnings of $1.04 per American Depositary Share (ADS) on a replacement cost basis, excluding non-operating items. The bottom line surpassed the Zacks Consensus Estimate of 78 cents and improved from the year-ago quarter’s 64 cents.
Total revenues of $76,885 million in the quarter improved from $70,022 million in the year-ago quarter and beat the Zacks Consensus Estimate of $60,718 million.
The increase in oil equivalent price realizations and ramped-up production from key upstream projects drove fourth-quarter results. Fuel marketing businesses also supported the outperformance — leading the stock to gain nearly 4% during pre-trading hours.
The integrated energy major continued to return cash to shareholders through buybacks and dividend payments. Through 2018, BP spent $355 million on the repurchase of 50 million shares.
Operational Performance
Upstream
In the fourth quarter, total production of 2.627 million barrels of oil equivalent per day (MMBoe/d) was higher than 2.581 MMBoe/d a year ago. Major upstream projects, which were brought online through 2018 since 2016, backed production volumes in the quarter.
The company sold liquids at $61.80 a barrel in the fourth quarter as compared with $56.16 a year ago. It sold natural gas at $4.33 per thousand cubic feet, compared with $3.23 a year ago. Overall price realization increased to $42.98 per barrels of oil equivalent (Boe) from the year-ago level of $37.48.
After adjusting for non-operating items and fair value accounting effects, underlying replacement cost profit before interest and tax for the segment was $3,886 million, up from $2,223 million a year ago. Higher production volumes along with increased realized prices from liquids & natural gas primarily drove the upside.
Downstream
Segmental profits increased to $2,169 million from $1,474 million in the year-ago quarter. Higher contributions from fuels marketing businesses led to the downstream outperformance.
Refining marker margin of $11 per barrel in the fourth quarter of 2018 was lower than $14.4 in the year-earlier quarter. Moreover, total refinery throughput decreased slightly to 1,666 thousand barrels a day (MB/d) from 1,698 MB/d a year ago.
Refining availability was 95.2%, compared with 96.1% in the year-ago quarter.
Rosneft
The segment recorded profits of $431 million, up from $321 million a year ago.
Financials
BP's net debt was $44,144 million at the end of the fourth quarter, higher than $37,819 million a year ago. Net debt ratio was 30.3%, above 27.4% in the prior-year quarter.
Oil Spill Costs
Through 2018, the integrated energy firm made a payment of $3.2 billion, after tax, associated with the oil spill incident in the Gulf of Mexico. BP has estimated oil spill payment to be roughly $2 billion in 2019.
Reserves Replacement Ratio
Including Rosneft, the company’s reserves replacement ratio (RRR) was recorded at 100% in 2018. Notably, BP’s RRR has been reported at 209%, considering acquisitions and divestments.
Outlook
The company expects oil and natural gas production in the January-to-March quarter of 2019 to be flat sequentially. Through 2019, the energy giant projects production volumes to increase, thanks to major upstream developments that came online over the years since 2016.
BP p.l.c. Price, Consensus and EPS Surprise
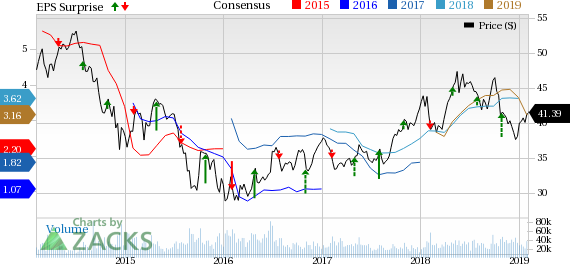
BP p.l.c. Price, Consensus and EPS Surprise | BP p.l.c. Quote
Zacks Rank and Key Picks
Currently, BP carries a Zacks Rank #4 (Sell). A few better-ranked stocks in the energy space are Jones Energy, Inc. (OTC:JONE) , Golar LNG Partners LP (NASDAQ:GMLP) and Sunoco LP (NYSE:SUN) . Jonescarries a Zacks Rank #2 (Buy), while Golar LNG and Sunoco sport a Zacks Rank #1 (Strong Buy). You can see the complete list of today’s Zacks #1 Rank stocks here.
Jones Energy expects 2019 earnings growth of 19% year over year.
Golar LNG delivered average positive earnings surprise of 92.8% in the preceding four quarters.
Sunoco LP pulled off average positive earnings surprise of 18.39% in the trailing four quarters.
Zacks' Top 10 Stocks for 2019
In addition to the stocks discussed above, would you like to know about our 10 finest buy-and-holds for the year?
Who wouldn't? Our annual Top 10s have beaten the market with amazing regularity. In 2018, while the market dropped -5.2%, the portfolio scored well into double-digits overall with individual stocks rising as high as +61.5%. And from 2012-2017, while the market boomed +126.3, Zacks' Top 10s reached an even more sensational +181.9%.
Golar LNG Partners LP (GMLP): Free Stock Analysis Report
Sunoco LP (SUN): Free Stock Analysis Report
BP p.l.c. (BP): Get Free Report
Jones Energy, Inc. (JONE): Free Stock Analysis Report
Original post
Zacks Investment Research