
Boston Properties Inc.’s (NYSE:BXP) fourth-quarter 2019 funds from operations (FFO) per share of $1.87 surpassed the Zacks Consensus Estimate of $1.85. The reported tally also increased 17.6% from the $1.59 reported in the year-ago quarter. In addition, it came in 2 cents higher than the mid-point of the company’s fourth-quarter guidance issued in October 2019.
Greater-than-projected portfolio performance, backed by higher occupancy, buoyed the company’s quarterly results. Further, total revenues witnessed more than 7% year-over-year growth. The company also increased its full-year 2020 FFO per share guidance from the prior projections.
Quarterly revenues from lease came in at $706.3 million, outpacing the Zacks Consensus Estimate of $697.2 million. Moreover, total revenues of $757.5 million climbed 7.4%, year on year.
For full-year 2019, the FFO per share came in at $7.01, ahead of the Zacks Consensus Estimate of $6.99 and higher than the prior-year tally of $6.30. Total revenues of $2.96 billion increased 9% year over year.
Inside the Headline Numbers
During the fourth quarter, the company completed and fully placed in-service the development projects — 145 Broadway — a 483,000-square-foot property in Cambridge, MA, that is 98% leased to Akamai Technologies (NASDAQ:AKAM), Inc, and The Hub on Causeway — Podium, a 382,000-square-foot project comprising retail and office space in Boston, MA, which is 99% leased. The company also signed 1.7 million square feet of leases.
As of Dec 31, 2019, Boston Properties’ portfolio comprised 196 properties, covering a total of around 52 million square feet of space. This included 11 under-construction properties.
Portfolio occupancy of 93% in the company’s in-service office properties marks an increase of 160 basis points from the fourth quarter of 2018.
Liquidity
Boston Properties exited 2019 with cash and cash equivalents of $644.95 million, up from $543.4 million as of Dec 31, 2018.
Outlook
The company has issued its first-quarter 2020 FFO per share guidance of $1.80-$1.82. The Zacks Consensus Estimate is pegged at $1.81.
For full-year 2020, Boston Properties increased its FFO per share guidance by a cent at the mid-point compared with the guidance provided on Oct 29, 2019. The company now projects 2020 FFO per share at $7.47-$7.65 per share, indicating 8% year-on-year projected growth at the mid-point. The Zacks Consensus Estimate for 2020 FFO per share is currently $7.55.
Our Viewpoint
We are encouraged with the Boston Properties’ better-than-expected performance in the fourth quarter. The company’s high-quality properties in select high-rent, high barrier-to-entry geographic markets enable it to enjoy strong leasing volumes amid healthy job-market environment, which supports its profitability. Also, its focus on opportunistic acquisitions and development projects are expected to contribute to cash flow over the long term.
Concurrent with the earnings release, Boston Properties also announced entering into a joint venture (JV) with Alexandria Real Estate Equities (NYSE:ARE) to develop, own and operate around 1.1 million square feet of existing office and lab properties in South San Francisco, CA. There is also the scope for expanding the campus though approximately 640,000 square feet of additional future development. Therefore, following completion of the master development plan, around 1.7-million-square-foot life-science campus, including a mix of office and lab buildings, is expected to be owned by the JV and once complete, Boston Properties will enjoy 50% ownership stake.
Boston Properties currently carries a Zacks Rank #2 (Buy). You can see the complete list of today’s Zacks #1 Rank (Strong Buy) stocks here.
Boston Properties, Inc. Price, Consensus and EPS Surprise
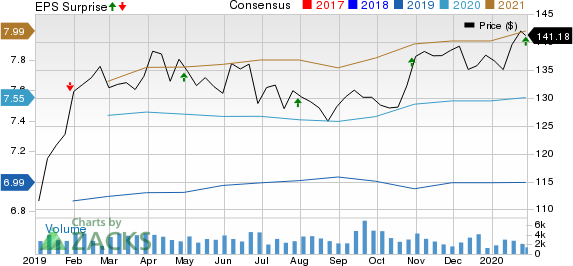
Boston Properties, Inc. price-consensus-eps-surprise-chart | Boston Properties, Inc. Quote
We now look forward to the earnings releases of other REITs like Highwoods Properties, Inc. (NYSE:HIW) and Cousins Properties Incorporated (NYSE:CUZ) , scheduled to release their quarterly numbers next week.
Note: Anything related to earnings presented in this write-up represent funds from operations (FFO) — a widely used metric to gauge the performance of REITs.
Looking for Stocks with Skyrocketing Upside?
Zacks has just released a Special Report on the booming investment opportunities of legal marijuana.
Ignited by new referendums and legislation, this industry is expected to blast from an already robust $6.7 billion to $20.2 billion in 2021. Early investors stand to make a killing, but you have to be ready to act and know just where to look.
See the pot trades we're targeting>>
Cousins Properties Incorporated (CUZ): Free Stock Analysis Report
Boston Properties, Inc. (BXP): Free Stock Analysis Report
Alexandria Real Estate Equities, Inc. (ARE): Free Stock Analysis Report
Highwoods Properties, Inc. (HIW): Free Stock Analysis Report
Original post
Zacks Investment Research