
It has been about a month since the last earnings report for Booking Holdings Inc. (NASDAQ:BKNG) . Shares have lost about 1.4% in that time frame.
Will the recent negative trend continue leading up to its next earnings release, or is BKNG due for a breakout? Before we dive into how investors and analysts have reacted as of late, let's take a quick look at the most recent earnings report in order to get a better handle on the important catalysts.
Booking Holdings (BKNG) Beats on Q1 Earnings & Revenues
Booking Holdings reported better-than-expected results in the first quarter of 2018.
Non-GAAP net earnings of $12 per share beat the Zacks Consensus Estimate by $1.38. Earnings increased 22% year over year but decreased 29% sequentially.
Revenues of $2.93 billion beat the Zacks Consensus Estimate of $2.87 billion. Also, revenues were up 4.5% sequentially and 21% from the prior-year quarter.
On a year-over-year basis, both the agency and merchant business showed strong momentum. Room nights, Rental cars and airline tickets, all performed impressively. On the call, management stated that the company will continue to focus on investments in people, systems and marketing with a long-term outlook.
Overall, we remain positive about the secular growth trend in the online travel booking market, Booking Holdings’ strong position in the international markets, growth opportunities in the domestic market, good execution, prudent marketing strategy and strong financial position.
However, weaker average daily rates for accommodations (ADR), macro headwinds, the increasing advertising spend and occupancy tax-related litigation remain overhangs.
Let’s check out the numbers.
Revenues in Details
Booking Holdings generates bulk of its revenues from the international markets where the agency model is more popular. This is reflected in the merchant/agency split of revenues, which was 18/73% in the fourth quarter (previous quarter split was (19/74%).
Merchant revenues were up 3.5% sequentially and19.1% year over year. Agency revenues increased 2% sequentially and 18.4% from the year-ago quarter.
Advertising & Other revenues were up 30% sequentially and 50.2% from the last year. These are basically non inter-company revenues from Kayak and OpenTable.
On a year-over-year basis, room nights volumes increased 13.2%. Also, rental car days increased 18.7% and airline tickets were up 1.9%.
Booking Holdings’ room night growth is attributable to geographically diverse inventory and brand recognition that tend to balance out macro uncertainties related to any one market, as well as growing competition from the local and international players.
Bookings
Booking Holdings’ overall bookings were up 20.9% (12% in constant currency) from the year-ago quarter and above management’s guided range.
Merchant bookings were up 74.1% from the prior-year quarter and agency bookings increased 13.4% from the year-ago levels.
Margins and Net Income
Owing to the nature of business and mix of agency versus merchant revenues, management usually uses gross profit dollars rather than margin to gauge performance during any quarter. Booking Holdings’ gross profit dollars were up 6% sequentially and 25.2% (18% in constant currency) from the last year.
Adjusted EBITDA in the first quarter was $798.2 million, up 25.7% from the year-ago quarter.
Booking Holdings’ operating income was up 31.2% year over year. Operating margin of 24.9% was up 190 bps from the year-ago quarter.
Balance Sheet
Booking Holdings ended the quarter with cash and short-term investments balance of $6.9 billion compared with $7.4 billion at the end of the fourth quarter. As of Mar 31, 2018, Booking Holdings generated $640.4 billion of cash from operations. It spent around $132 million on capex. Free cash flow in the quarter was $508.4 million.
At quarter-end, Booking Holdings had $8 billion of long-term debt.
Guidance
For the second quarter of 2018, Booking Holdings expects room nights booked to grow 7-11% and total gross bookings to increase 10-14% year over year (5-9% on a constant currency basis).
The company expects adjusted EBITDA in the range of $1,085-$1,125 million.
Pro-forma EPS is expected to come in the range of $16.35-$17.00. GAAP EPS is expected within $15.50-$16.15.
How Have Estimates Been Moving Since Then?
In the past month, investors have witnessed an upward trend in fresh estimates. There have been 11 revisions higher for the current quarter compared to two lower.
Booking Holdings Inc. Price and Consensus
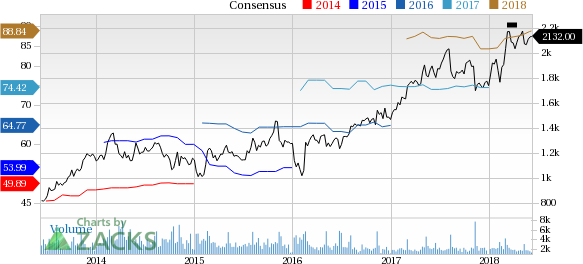
Booking Holdings Inc. Price and Consensus | Booking Holdings Inc. Quote
VGM Scores
At this time, BKNG has a nice Growth Score of B, a grade with the same score on the momentum front. However, the stock was allocated a grade of D on the value side, putting it in the bottom 40% for this investment strategy.
Overall, the stock has an aggregate VGM Score of C. If you aren't focused on one strategy, this score is the one you should be interested in.
Zacks style scores indicate that the company's stock is suitable for growth and momentum investors.
Outlook
Estimates have been broadly trending upward for the stock and the magnitude of these revisions looks promising. Notably, BKNG has a Zacks Rank #3 (Hold). We expect an in-line return from the stock in the next few months.
Booking Holdings Inc. (BKNG): Free Stock Analysis Report
Original post
Zacks Investment Research