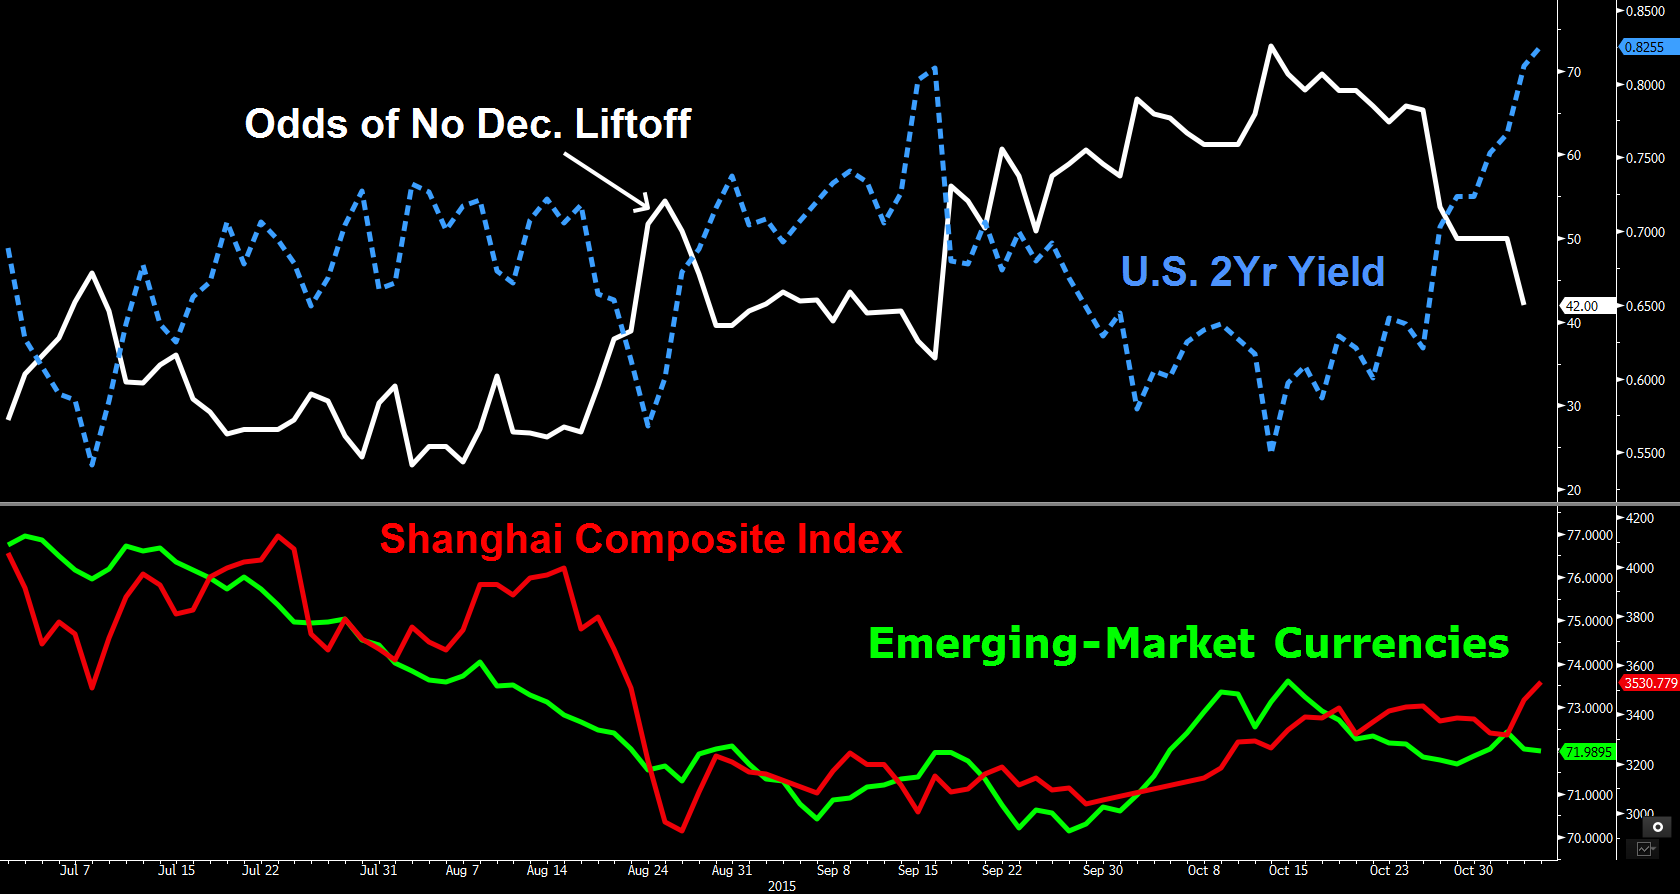
- Market implied odds of Fed rate increase in 2015 rise to 58%
- Ruble, ringgit lead developing-nation currencies lower
Weaker developing-nation currencies and rising bond yields show that once again Janet Yellen has global investors pondering whether markets can withstand an increase in U.S. interest rates before year-end.
Russia’s ruble and Malaysia’s ringgit led declines as the Bloomberg Dollar Spot Index climbed toward its highest level since March after the Federal Reserve chair signaled liftoff was possible in December. Treasury two-year note yields climbed to the highest since 2011 and Australian 10-year yields advanced for a sixth day. Stocks showed less concern, trading little changed in Europe, while in China, government support underpinned a rebound from a $5 trillion stock rout, sending the Shanghai Composite Index into a bull market.

Traders have boosted the odds of a December rate increase to 58 percent from as low as 27 percent midway through last month. The probability jumped on Wednesday after Yellen told lawmakers that improvements in the U.S. economy meant raising rates next month was a “live possibility” and a services industry report exceeded analysts’ estimates. Payrolls data on Friday will probably show the U.S. added more jobs in October, bolstering the case for higher rates.
Reports showing U.S. economic strength on Wednesday “gave the markets more confidence that not only was the Fed looking for a December rate hike but the data would support it as well,” said Eimear Daly, a currency strategist at Standard Chartered Plc (L:STAN) in London. “With further reassurance from Yellen and a number of speakers, it is the classic monetary policy divergence theme.”

Currencies
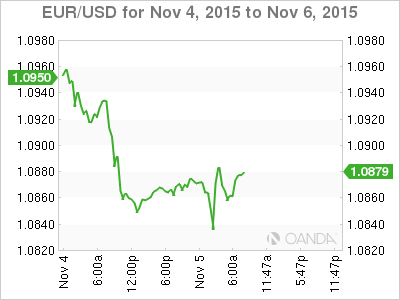
The Bloomberg Dollar Spot Index, a gauge of the greenback against 10 major peers, climbed 0.2 percent at 10:20 a.m. in London, after jumping 0.7 percent last session, the most since Oct. 22. The euro was little changed at $1.0866 after touching its lowest level since July 21, while the yen fell for a fourth day, dropping 0.3 percent to 121.95 per dollar.
Russia’s ruble slid 1.2 percent. The Malaysian ringgit led declines among currencies in Asia, slipping 0.7 percent for its first decline this week. The Korean won depreciated 0.6 percent from a 1 1/2-week high.
“The dollar is being bought gradually, with markets pricing in the rate increase as data come out and yields rise,” said Naohiro Nomoto, an economist in New York at Bank of Tokyo-Mitsubishi UFJ Ltd. “Fed officials appear to be setting up for the move.”
Norway’s krone climbed against all its major peers after its central bank kept interest rates unchanged. The currency strengthened 0.6 percent to 8.5736 per dollar, after earlier reaching 8.6787, the weakest since 2002.
Bonds
Two-year U.S. Treasury notes fell for a seventh day, with yields rising one basis point to 0.83 percent. A sale of two-year notes on Wednesday drew the weakest demand for the issue since 2010.
The yield on U.K. two-year notes climbed to the highest since October 2014 before the Bank of England sets policy Thursday. The yield added two basis points to 0.73 percent, while the 10-year yield climbed one basis point to 2.01 percent.
The cost of insuring investment-grade corporate debt held near the lowest since mid-September. The Markit iTraxx Europe Index of credit-default swaps was little changed at 70 basis points. The Markit iTraxx Europe Crossover Index of default swaps on non-investment grade companies rose one basis point to 290 basis points.
Yields on 10-year Australian debt rose five basis points to 2.78 percent. Rates on New Zealand notes added two basis points to 3.38 percent.
Emerging Markets
The MSCI Emerging Markets Index slid 0.5 percent as benchmark gauges in India, Turkey, the Philippines and Thailand dropped at least 0.7 percent.
The Shanghai Composite Index jumped 1.8 percent, taking its rebound from this year’s low on Aug. 26 to more than 20 percent, ignoring the Fed-fueled selloff. Hong Kong’s Hang Seng China Enterprises Index gained 0.5 percent.
The government responded to the equity-market crash that began in June by banning major stockholders from selling shares, curbing short selling and directing state funds to purchase stocks. China has cut its benchmark interest rate six times in the past year to a record low of 4.35 percent to keep growth on track.
“All the sellers who needed to sell have,” said Francis Cheung, a senior strategist at CLSA Ltd. in Hong Kong. “The government has successfully clamped down on short selling. So it is easier for market to go up, especially with anticipation that China will cut rates and do more stimulus.” He said he favored interest-rate sensitive sectors such as banks, property and Internet companies.
Stocks
The Stoxx Europe 600 Index added 0.2 percent, after three days of gains. Societe Generale SA (PA:SOGN) and AstraZeneca PLC (N:AZN) added at least 3.1 percent after their earnings beat estimates. Adidas AG (DE:ADSGN) climbed 4 percent after raising its full-year outlook.
Energy companies posted the worst performance among industry groups, with Amec Foster Wheeler PLC (L:AMFW) slumping 25 percent after saying it will halve dividends amid falling oil prices.
Credit Agricole SA (PA:CAGR) dropped 6 percent after its net income fell at its corporate and investment bank. Adecco SA (VX:ADEN) slid 8.1 percent after the world’s largest provider of temporary staffing trimmed its profit margins.
Standard & Poor’s 500 Index E-mini contracts expiring in December rose 0.2 percent. The underlying gauge fell yesterday.
Facebook Inc (O:FB) added 4 percent in premarket trading after its quarterly sales beat estimates.
Commodities
Copper fell the most in a week as investors weighed the prospect of higher U.S. interest rates and stockpiles tracked by the London Metal Exchange increased by the most in two months. Prices dropped 1.3 percent to $5,070 a metric ton. Aluminum, lead, nickel and zinc also fell in London trading.
Oil in New York was steady near $46 a barrel after falling the most in three weeks amid rising U.S. stockpiles. U.S. inventories increased by 2.85 million barrels through Oct. 30 as production climbed for a second week, according to an Energy Information Administration report. There is no clear sign of a recovery in oil prices, Kuwait Oil Minister Ali Al-Omair said in an interview.
Crude has slumped about 40 percent the past year and fluctuated between $40 and $51 the last two months amid speculation a global glut will be prolonged as the Organization of Petroleum Exporting Countries continues to pump above its collective target.
