
The US dollar traded lower against its major peers, while equities rebounded, as US Treasury yields retreated. As for today, 10-year Treasury auction and the US CPIs for February may attract special attention. Apart from that, we also have a BoC monetary policy decision, and it will be interesting to see whether officials will sound more dovish this time around.
Equities Rebound As Treasury Yields Retreat
The US dollar traded lower against all but one of the other G10 currencies on Tuesday and during the Asian session Wednesday. It lost the most ground versus CHF, SEK and JPY, while it gained some ground only versus CAD.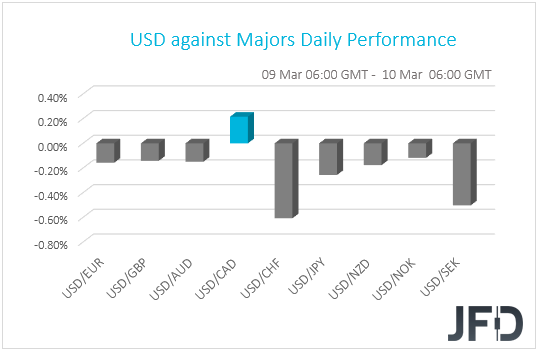
The weakening of the US dollar may have been the result of the retreat in US Treasury yields, that’s why stocks may have rebounded. Indeed, turning our gaze to the equity world, we see that major EU and US indices were a sea of green, with the tech-heavy NASDAQ gaining 3.69%, recording its best day since Nov. 4. Sentiment was more mixed today during the Asian session. Japan’s Nikkei 225 and Hong Kong’s Hang Seng gained 0.03% and 0.23% respectively, but China’s Shanghai Composite and South Korea’s KOSPI slid 0.05% and 0.60%.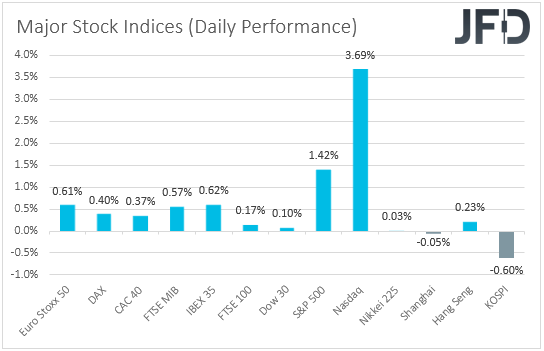
The recent rally in bond yields has hurt tech stocks the most, due to their high valuations. High-growth tech companies are valued based on earnings expected years into the future, and thus, when yields rise, their discounted present value declines. The opposite is true when yields retreat. That’s why NASDAQ was the main gainer yesterday.
As for today, bearing in mind that the latest surge in bond yields was attributed to fears over high inflation in the not-too-distant future, a 10-year Treasury auction and the US CPIs for February may attract special attention. The headline CPI rate is forecast to have risen to +1.7% yoy from +1.4%, while the core one is anticipated to have held steady at 1.4% yoy. In our view, rising headline inflation may add to concerns over high inflation and thereby push yields higher. As a result, the US dollar could strengthen and equities could resume their slide.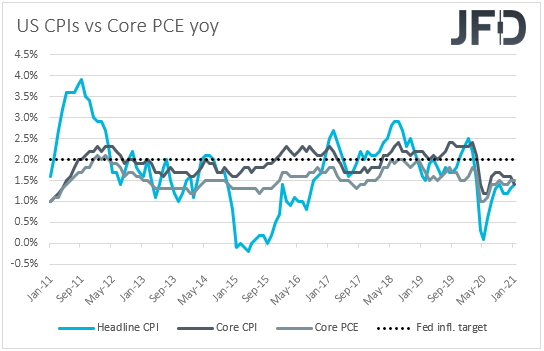
Having said all that though, we stick to our guns that the latest decline in equities, and any short-term extensions of it, may be a corrective phase. The Fed has clearly noted that any spike in inflation in the months to come will be temporary and that inflation will rise and stay above 2% for some time in the years after 2023. As a result, we believe that inflation fears will subside in the foreseeable future, which may allow equities and other risk-linked assets to perform well.
NASDAQ 100 Technical Outlook
Yesterday, NASDAQ 100 managed to recover all the losses made on Monday, but still this was not enough for the index to get back what was lost during last week. The index continues to trade below a short-term downside resistance line taken from the high of Feb. 16. As long as that downside line remains intact, there is a good chance that we are not done with the downside moves. That said, to get a bit more comfortable with that idea, we would prefer to wait for a push below the 12719 hurdle first. Until then, we will stay cautiously bearish with the near-term outlook.
If NASDAQ 100 drifts below the 12719 zone, marked by an inside swing high of Mar. 8, that could attract more sellers into the game, potentially increasing the chances for the index to slide further. We will then aim for the 12459 obstacle, a break of which may set the stage for a move to the current lowest point of this week, at 12288.
If the price somehow manages to bypass the aforementioned downside linen and then climbs above the 13054 barrier, marked by the inside swing low of Mar. 2, that may increase NASDAQ’s chances of moving further north. The index might travel to the 13195 obstacle, a break of which may lead to the current highest point of march, at 13331. Slightly above it lies another level, which might get tested, at 13360, marked by the high of Feb. 25.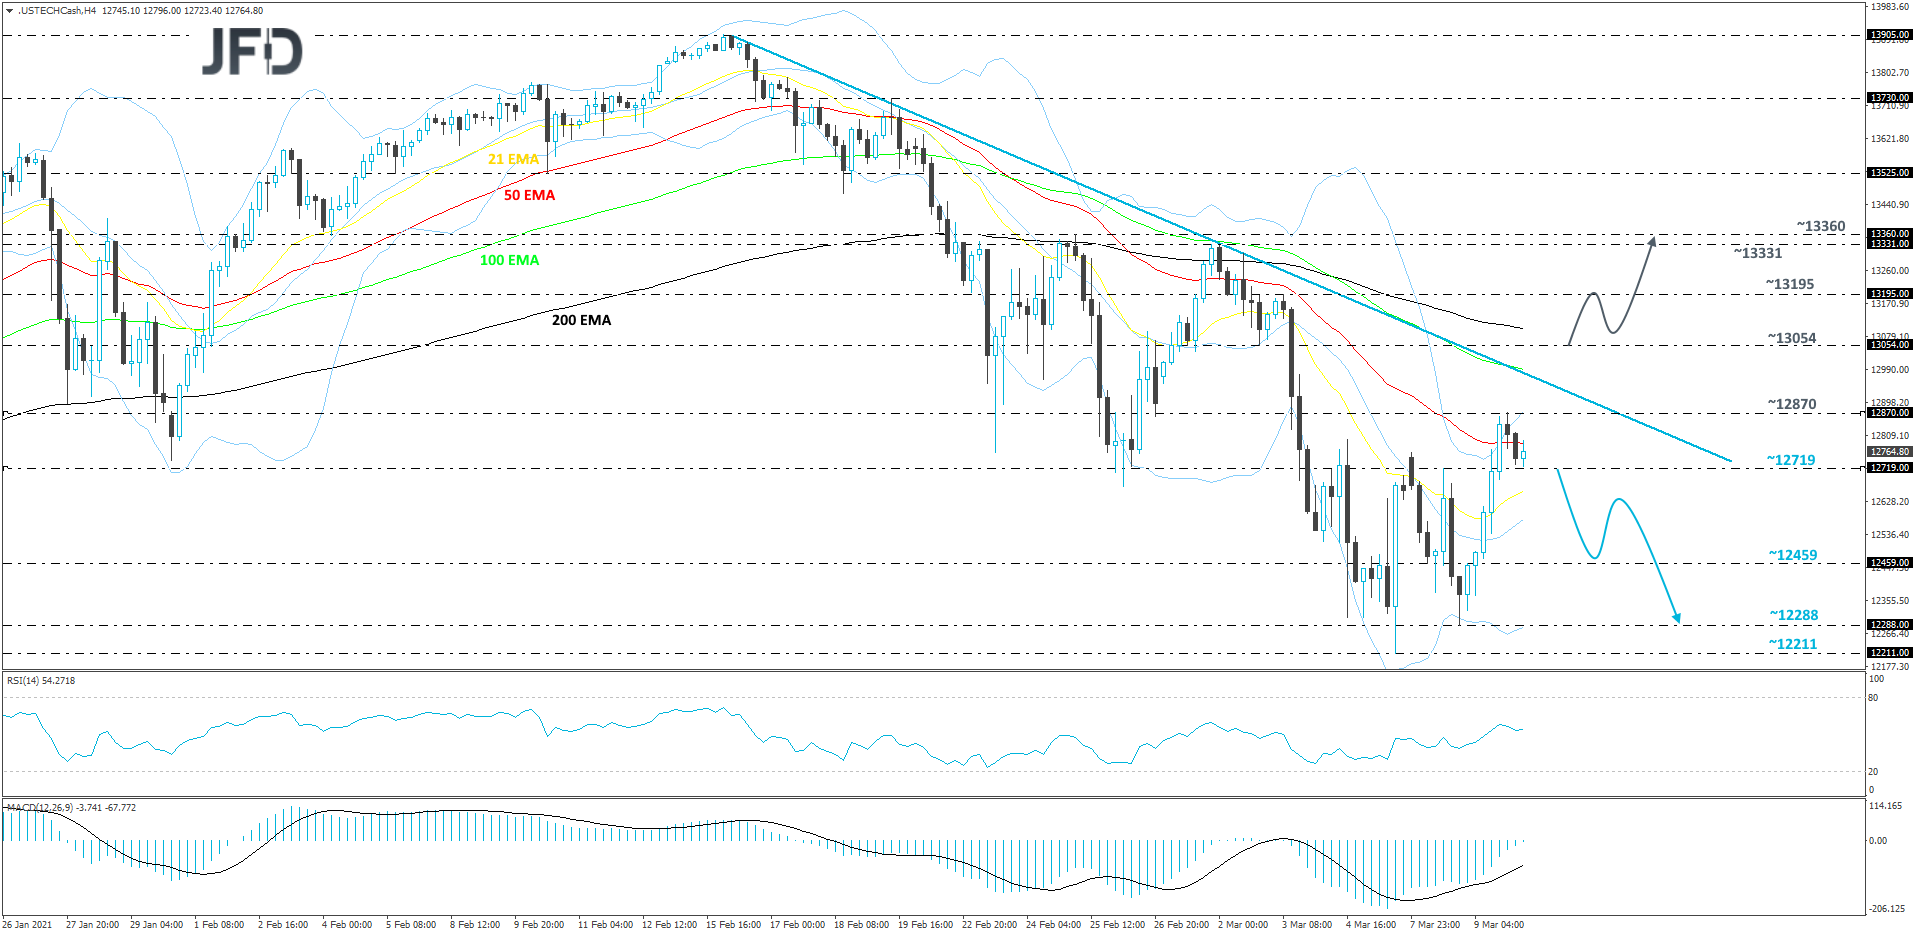
Will The Bank Of Canada Sound More Dovish?
Apart from the US CPIs and any movements in bond yields, market participants may also pay attention to the BoC monetary policy decision. At its prior meeting, the BoC decided to keep interest rates and the pace of its QE purchases unchanged, disappointing those expecting a small cut or even a re-increase in QE. Officials also noted that “As the Governing Council gains confidence in the strength of the recovery, the pace of net purchases of Government of Canada bonds will be adjusted as required", which suggests that the next policy step for the BoC may be tapering QE.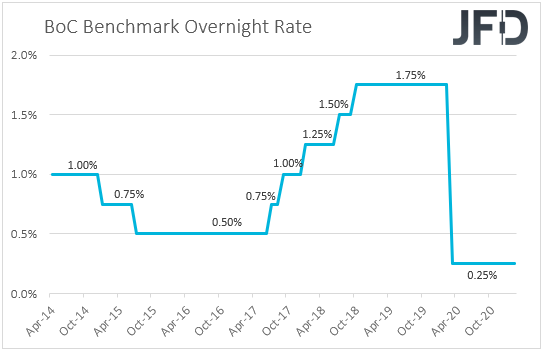
However, the employment report for January disappointed, with the unemployment rate rising to 9.4% from 8.9%, and the net change in employment showing that the economy has lost 212.8k jobs. What’s more, although the CPIs for January came in better than expected, they still stayed below the BoC’s inflation aim of 2%, while last week, GDP data showed that the Canadian economy has slowed more than anticipated in December. Thus, with that in mind, we don’t believe that tapering may be on the cards for the months to come. We expect BoC officials to sound more dovish this time around, diminishing expectations on that front, something that could hurt the Canadian dollar.
That said, we expect any retreat in the Loonie to be temporary. Oil prices surged after the decision from OPEC and its allies not to increase output, and although they pulled back this week, they stayed in uptrend mode. What’s more, as we already noted, we expect equities to rebound soon, something that may keep the commodity-linked Loonie supported as well.
AUD/CAD Technical Outlook
Although yesterday we saw AUD/CAD retracing up a bit, the pair remains below a short-term downside resistance line drawn from the high of Feb. 25. If that line continues to provide strong resistance, another move lower might be possible. But to get a bit more excited with that scenario, a drop below 0.9723 hurdle would be required. Hence our cautiously-bearish approach for now.
If the pair, eventually, falls below the 0.9723 zone, marked near an intraday swing high of Mar. 8 and the current low of today, that could invite a few more bears into the game. If that happens, the rate could end up sliding to the 0.9705 obstacle, a break of which may open the door for a move to the 0.9665 level, marked by the current lowest point of March.
Alternatively, if the pair overcomes the previously discussed downside line and then pushes through the 0.9790 barrier, marked near the low of Feb. 26, that could change the direction of the current short-term trend, this way inviting even more buyers into the game. We will then target the 0.9823 obstacle, a break of which could set the stage for a push to the 0.9874 level, marked by the high of Mar. 4.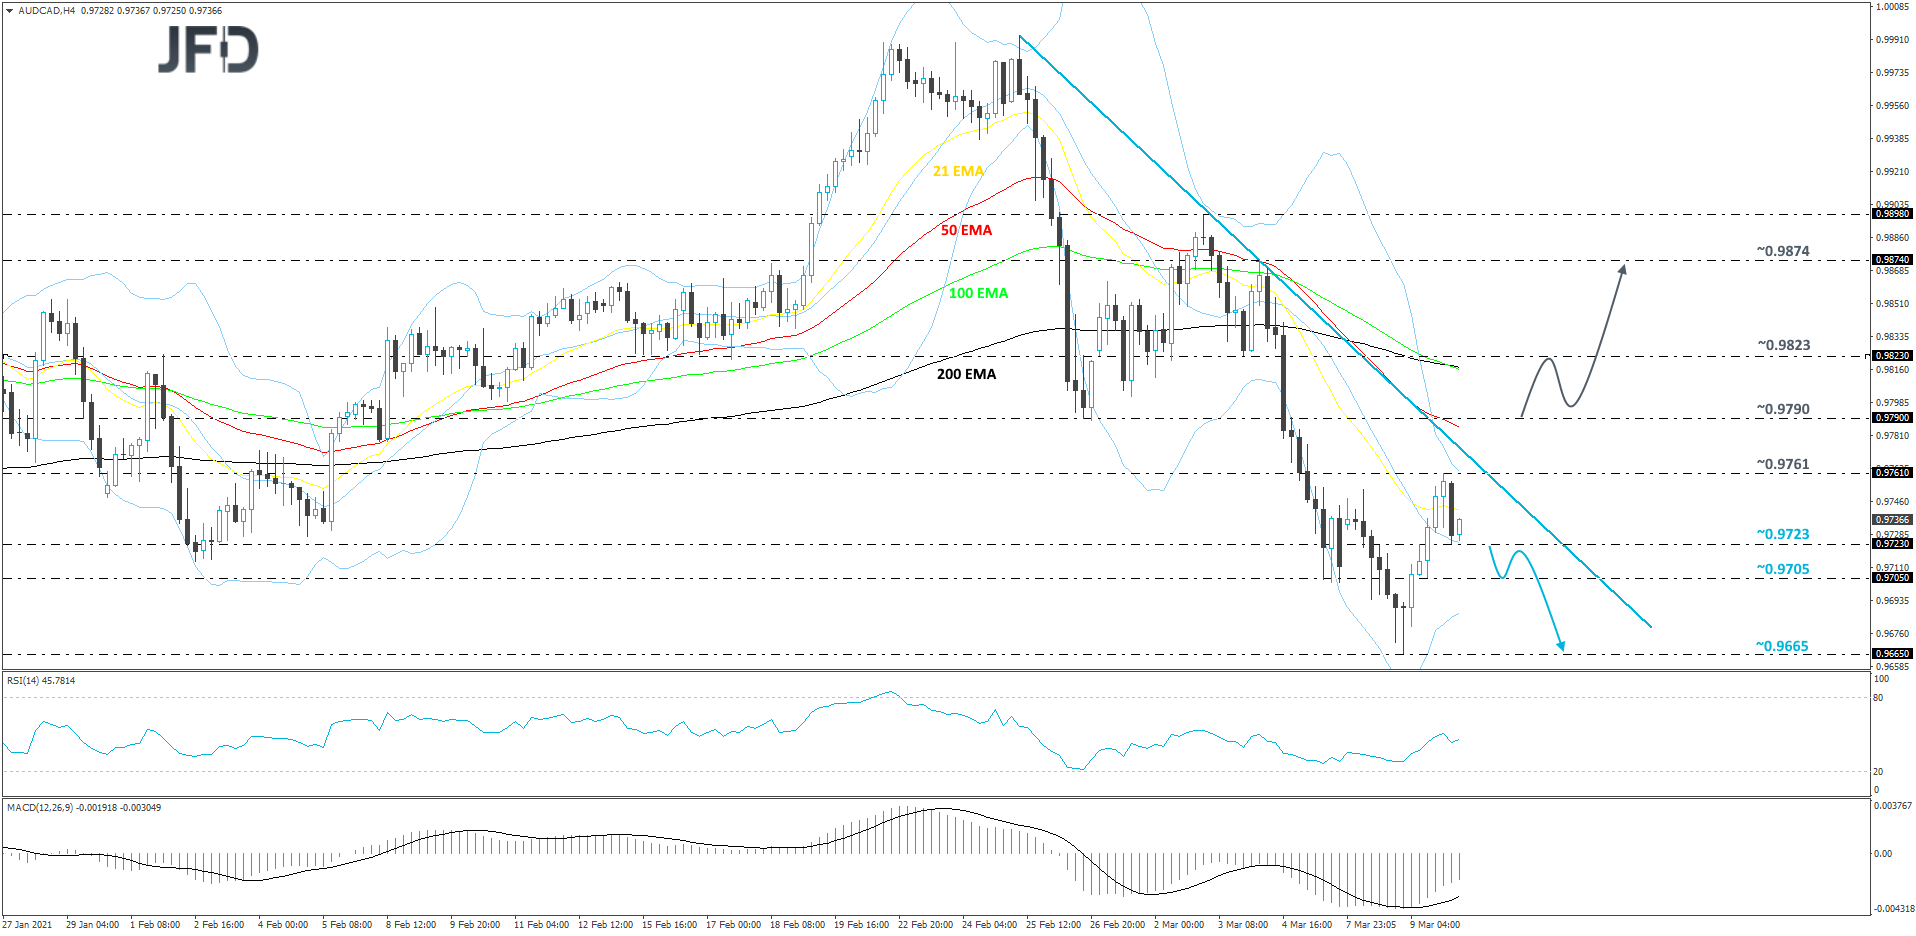
As For The Rest Of Today's Events
Apart from the US CPIs and the BoC monetary policy decision, we have the EIA (Energy Information Administration) report on crude oil inventories for last week. Expectations are for a 0.816mn barrels inventory build, after the 21.563mn surge the week before. That said, bearing in mind that the API (American Petroleum Institute) reported a 12.792mn barrels build, we would consider the risks to the EIA print as tilted to the upside. A positive surprise may allow oil prices to continue correcting lower for a while more.