
Summary
This was a quiet week in the Treasury market.
I look at the yield curve at the beginning of August and compare it to the yield curve at the beginning of each of the last seven months.
I also look at the spread between various maturities.
There wasn't much news in the bond market this week. So, let's use this lull to look at the developments in the yield curve this year, comparing Friday's curve to the curve at each of the preceding months, beginning with January:
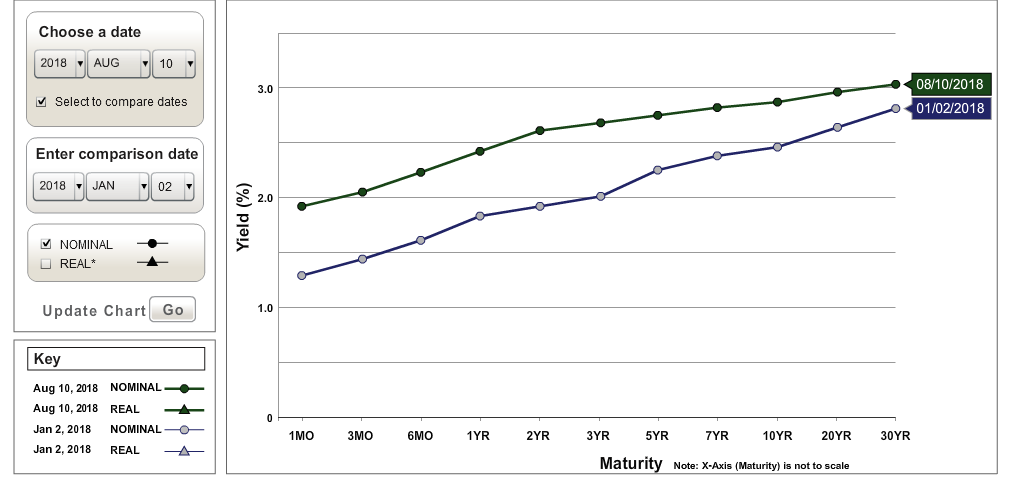
At the beginning of the year, the curve was a lot lower by Treasury market standards. The short-end of the curve was about 75 basis points lower while the long-end was about 25 BP lower.
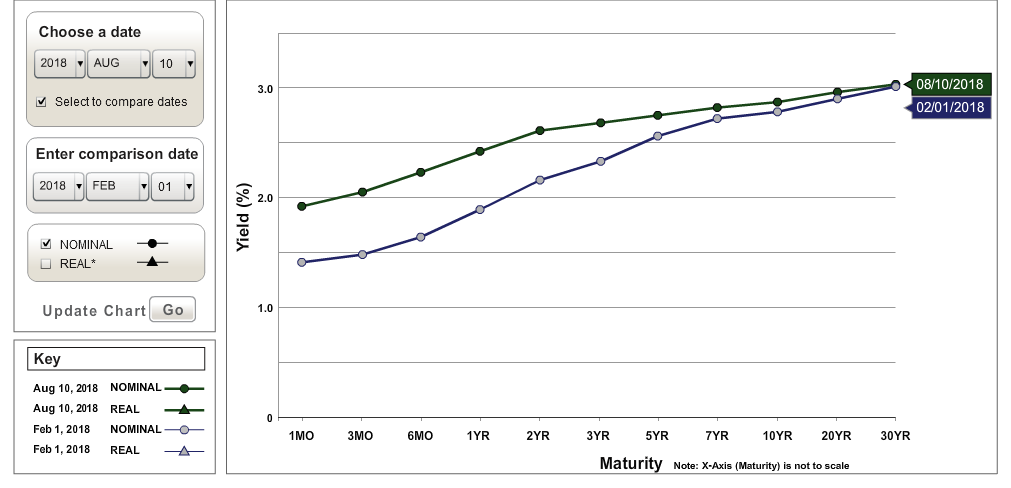
By February, the long-end had moved about 25 BP (LON:BP) higher to more or less where it is right now. Also, note how much the five-year section of the curve rose - it was nearly at August's level by February. The short-end was starting to increase, but it had a bit to go; the Fed was just starting to raise rates.
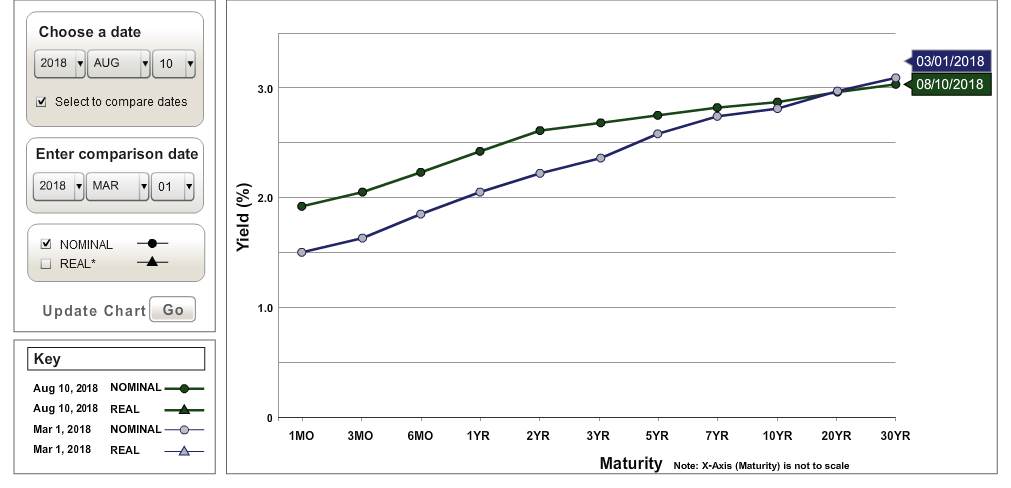
By the beginning of March, the longer end of the curve continued to rise, with the 30-year bond slightly above current levels. The short-end continued to inch higher.
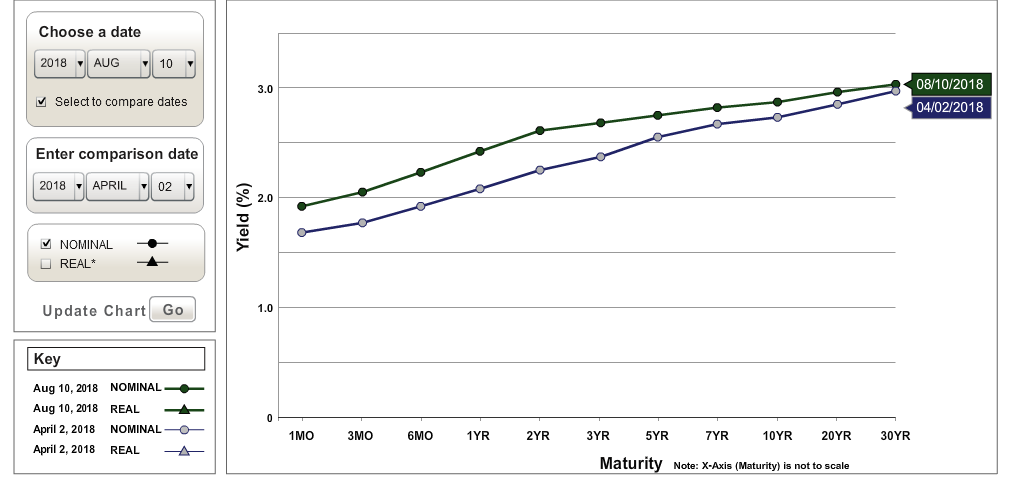
By the beginning of April, the short-end of the curve was a lot closer to current levels due to the Fed raising rates 25 basis points at its March meeting. The long-end of the curve had tightened a bit.
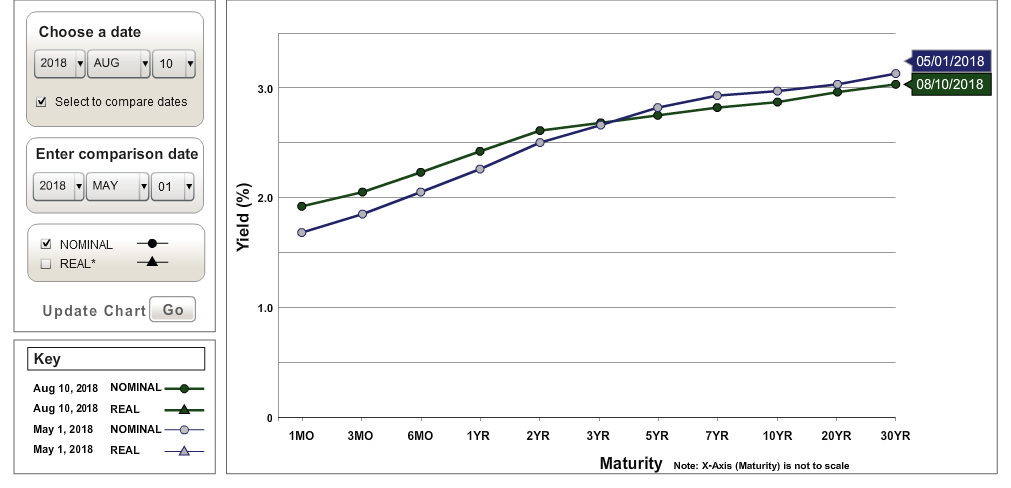
At the beginning of May, the three-year acted as a fulcrum for the curve. Longer yields were above current levels and shorter yields were below. But the long-end wasn't above by a great deal. If you looked at this data from a longer-term perspective, you'd say it was statistical noise. The short-end continued to inch higher.

By the Beginning of June, long-term rates were at current levels while the short-end of the curve was slightly below current levels.

July's curve is very similar to June's. But, again, from a longer-term perspective, the difference is more noise than meaningful difference.
Let's place this information into a different context by looking at various yield curves:
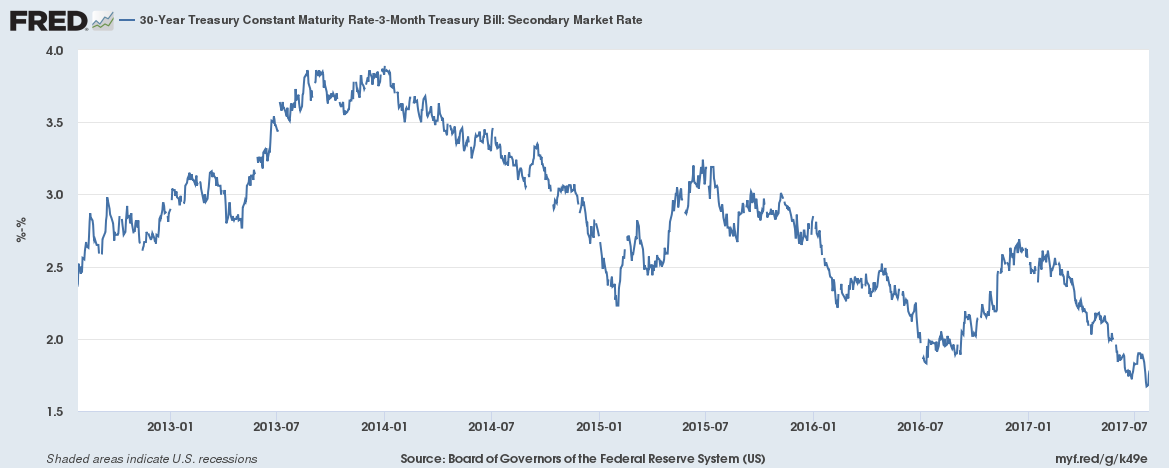
The total yield curve - the 30-year-3-month rate - continues to narrow. But it's still pretty wide by historical measures.
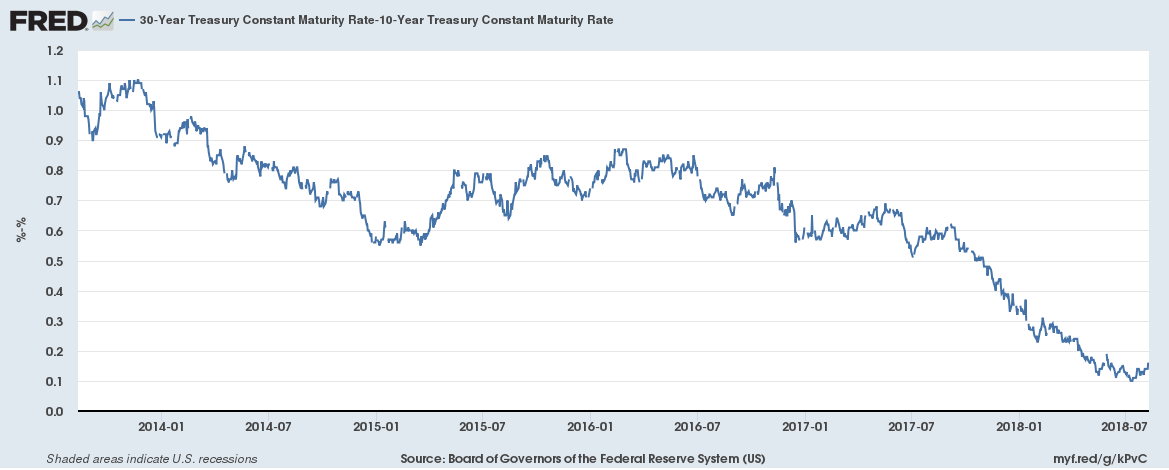
The long-end of the curve - the difference between the 30- and 10-year - is now incredibly narrow; it's somewhere between 10 and 20 basis points. It's narrowed a great deal over the last 12 months, falling from 50 basis points to its current level.
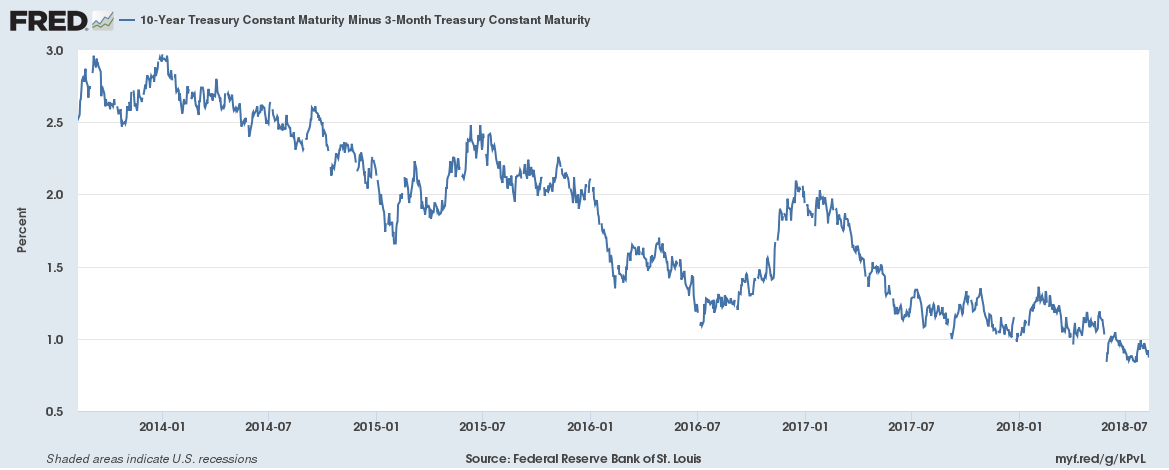
The financial press has been eyeing the 10-year-3-month yield for the last year, writing somewhat alarmist articles when it falls below 1%. Right now, it's just below that level. This part of the curve has inverted between 12-18 months before each of the last 7 recessions.
Right now, the yield curve is about what you'd expect it to be late economic cycle.
Disclosure:I/we have no positions in any stocks mentioned, and no plans to initiate any positions within the next 72 hours.
I wrote this article myself, and it expresses my own opinions. I am not receiving compensation for it (other than from Seeking Alpha). I have no business relationship with any company whose stock is mentioned in this article.