There are two principal forces that motivate me in my life: (1) my family (2) Slopers, the latter of which is like a much larger version of my family, except that I’ve never really met them.
The former force is compelling me to travel almost nonstop from Friday through Monday. I won’t go into details, but I will have never spent so much time in an airplane in my life. The latter force – – you – – should get some content, which is why, even in the back of an Uber, I am typing this post at this very moment to fulfill my quasi-familial duty while listening to an endless stream of 80s musics from the radio my driver is playing.
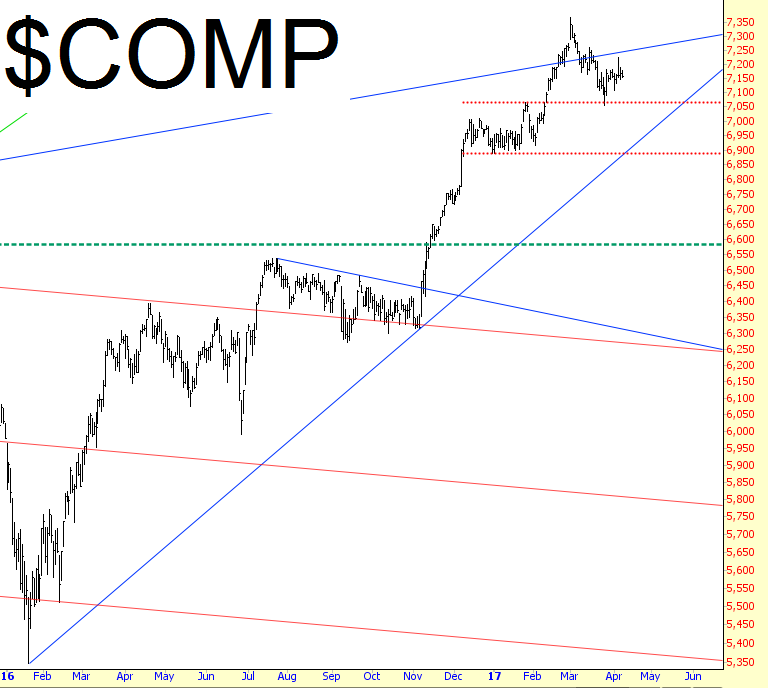
The market’s dynamism has been kind of beaten out of it. I’m hoping the forthcoming earnings season will shake things up, preferably to the downside (of course, the potency of “hope” over the past eight years has been, shall we say, spotty). The Dow Jones Composite is, umm, just kind of sitting there.
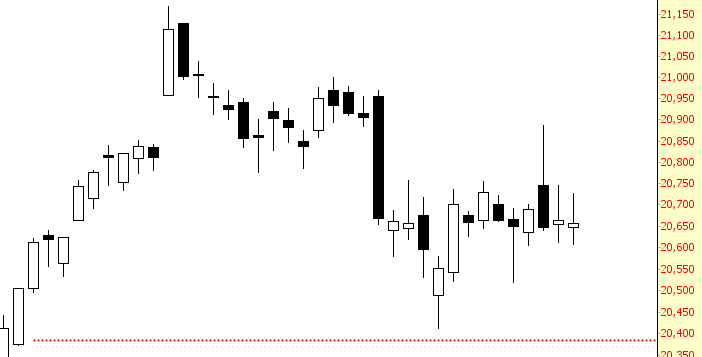
A superb example of the moribund nature of this market can be seen by way of the Dow Industrial Average. Thursday and Friday should have provided ample fireworks for the market. In a different environment, the one-two punch of the Syrian missile attack and the lame-o jobs report would have caused equities to go berserk. But in this market the Dow was, I kid you not, down three hundredths of a single percentage point. Jesus Tap-Dancing Christ, I miss 2008.
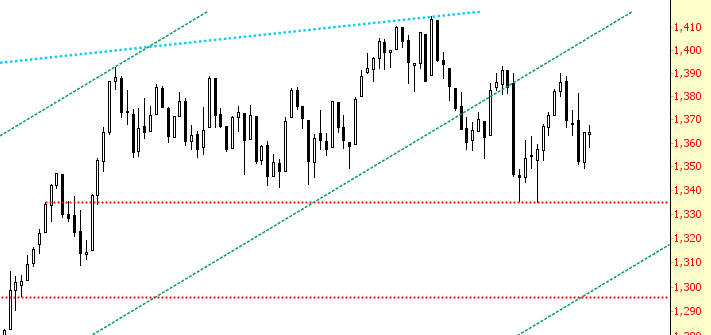
One faint wish I’m clinging to is for the Russell 2000 to break its horizontal at 1335, shown below via that red line. Break that, and we can get a little action.
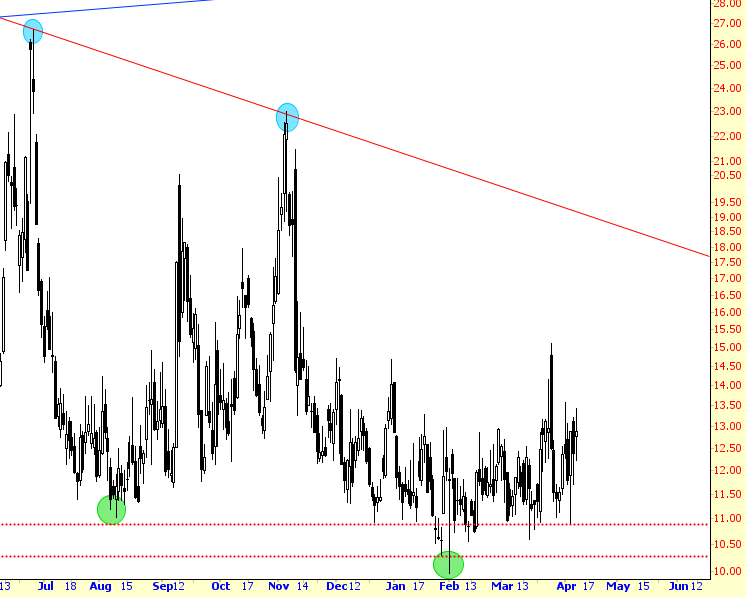
Perhaps my favorite chart right now is the VIX. Not to sound overly entitled, actually, I don’t care if I do or not, we are due for a bounce in the VIX. Just look at the chart. It is just itching to pop.
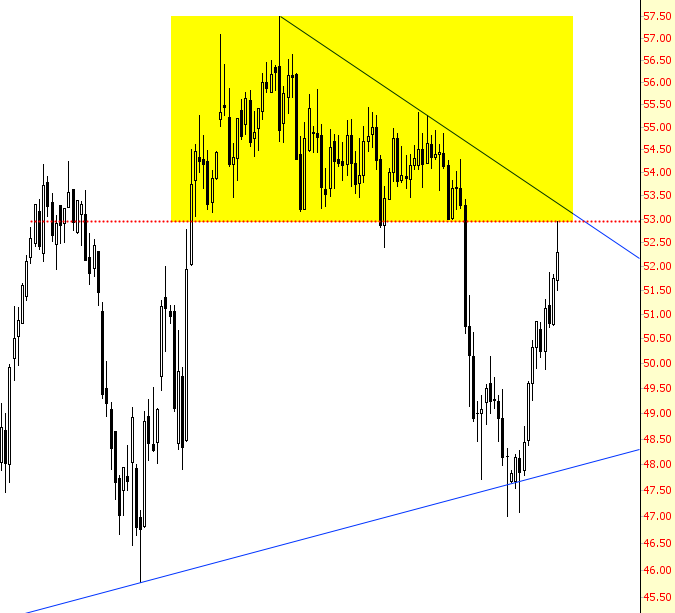
Of course, crude oil remains a fixation of mine. The strength we saw on Friday, Zeus willing, will constitute the terminus of its countertrend bounce. I’ve tinted what I contend is a strong topping pattern for oil.
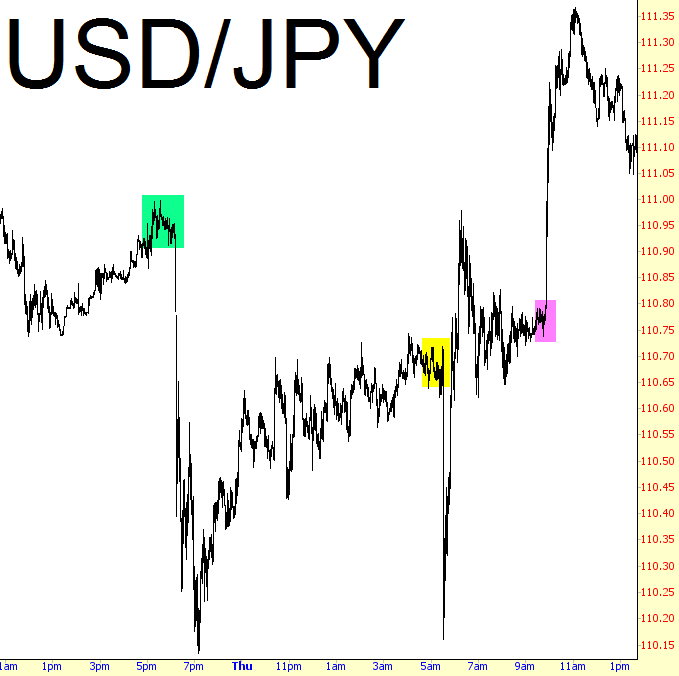
Lastly, one area that did see some excitement was the US dollar/Japanese yen cross-rate. Fortunes must have been made and lost in the span of twelve hours. First there was the plunge based on the Syrian missiles (green tint), then the recovery, only to be undone by another plunge (yellow tint), this one based on the jobs report. Lastly, there was the out-of-nowhere surge (tinted in magenta) predicated, I believe, on some hawkish comments from a Fed dude. Just crazy.
I personally think the market we’re in today makes 1999 look like the sober face of reason. People have gone stark raving mad, and in doing so, they have embraced unshakeable complacency as a lifestyle.
