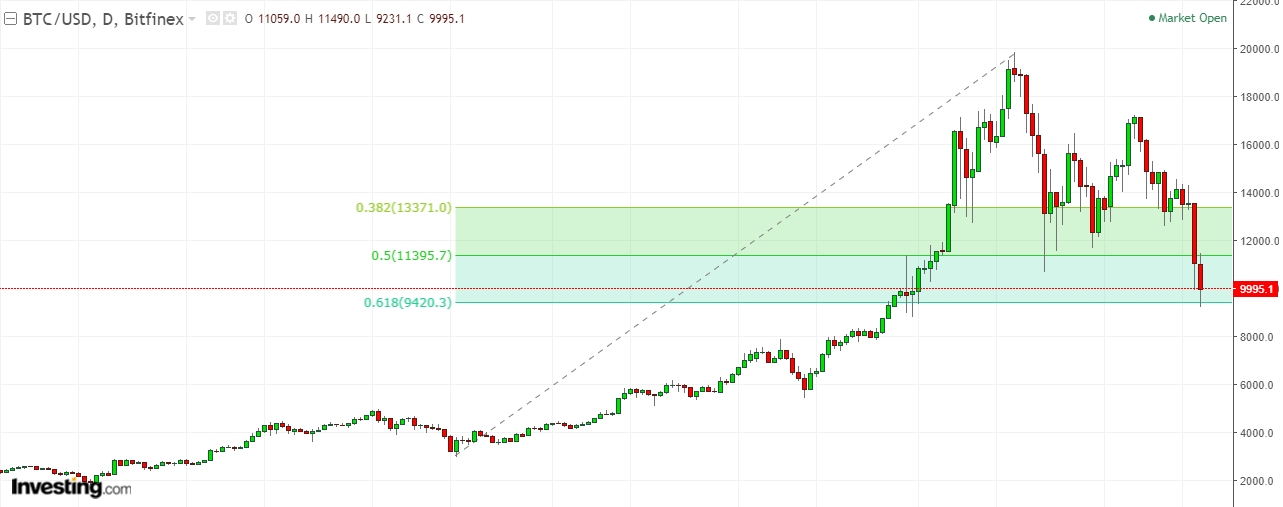
After the strong surge in bitcoin price, the bears have finally managed to push the price significantly down in the global market. Prior to the bearish dive, the BTC/USD secured a record high at 19849.3 in the global market. From that level, the sellers pushed the price down towards the minor support level at 11374.8.Though this level provided some initial support to the bitcoin bulls the sellers finally managed to break through this level on the basis of daily closing. Currently, the price is testing the 61.8% Fibonacci retracement level drawn from the low of 15th September 2017 to the high of 17th December 2017.
BTC/USD daily chart analysis
Figure: Decent bounce in BTC/USD at the 61.8% retracement level
From the above figure, you can clearly see that the price is currently testing a major support level at 9371.0.Most of the professional traders are cautiously observing this level since any bullish price action confirmation signal will be an excellent opportunity to execute fresh long orders. According to the recent statement of Alex Faliushin chief analyst of CoinLoan, Virtual Currencies may hold long-term promise, particularly if the innovations promote a faster, more secure and more efficient payment system. Such an optimistic statement refueled the cryptocurrency bulls in the global market despite the recent downfall.
If the bulls manage to push the price higher from the current support level at 9371.0, we will see a sharp rally towards the next critical resistance level at 13420.4.This level is going to provide a significant amount of selling pressure, however, a daily closing of the price above that level will confirm the completion of bearish retracement in the BTC/USD. On the downside, if price breaks below the critical support level at 9371.0 the bulls will be in great trouble. Most importantly the long-term bullish trend will be at risk. A clear break of the 61.8% retracement level will ultimately lead this pair towards the next critical support level at 7000 (Strong psychological level).This level is very crucial for the long-term cryptocurrency investors since lots of fresh buying orders are most likely to push the price of bitcoin higher from that level. However, a clear break of that level will create massive chaos in the global market since the ultimate stop for the BTC/USD will be at 4945 level.
Considering all the technical parameters the bulls are still not in full control of this market. If the current support level manages to limit the bearish movement, we might have a golden opportunity to execute fresh long orders. However, in the absence of definite bullish reversal signal, entering long at the current price level will be an immature act. So it’s better to wait on the sideline until the bulls regain their control in this market.

