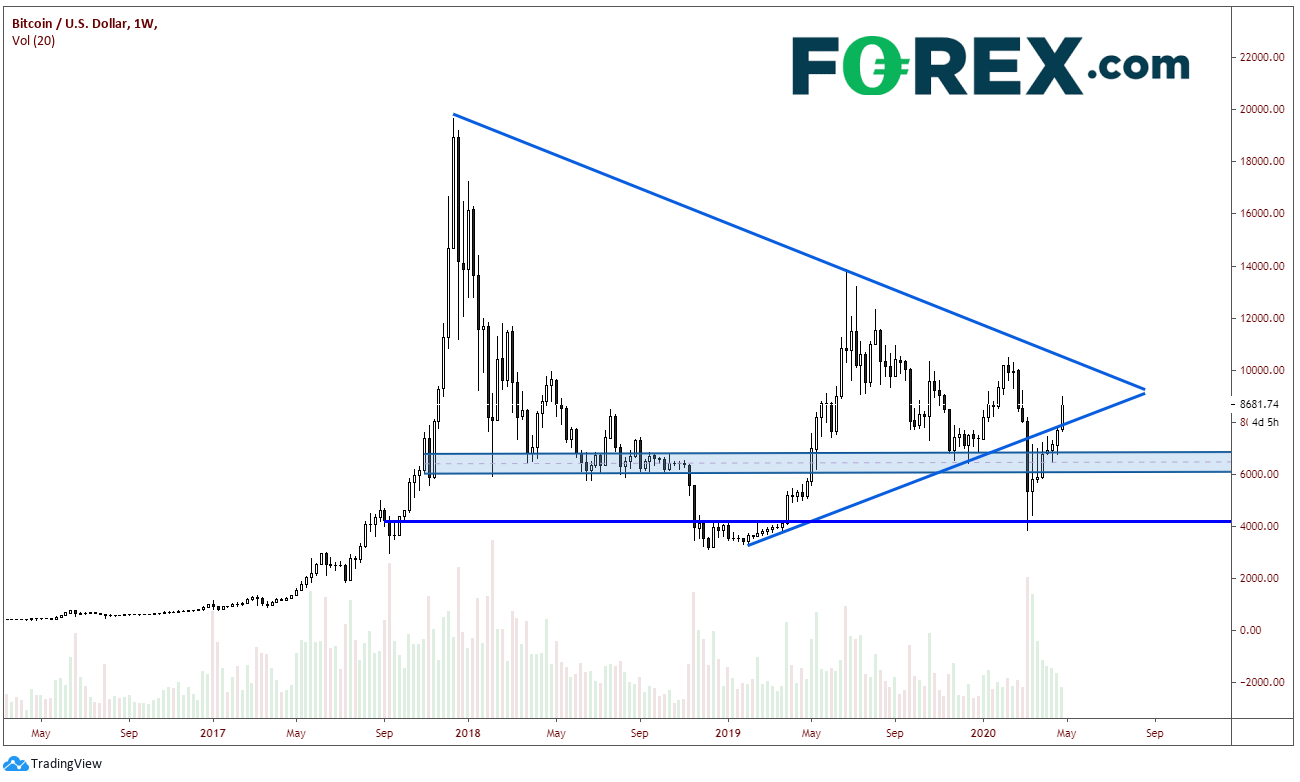
There has been lots of chatter lately surrounding Bitcoin (BTC), with price yesterday rising almost 12.5% to an intraday high of $8,970. One reason is that in the coming weeks, Bitcoin will be “halving.” For simplicity sake, this means that every time 210,000 “blocks” are created by miners, the total number of Bitcoin are cut in half. This process is currently on pace to end in the year 2140, with a total of 21 million coins.
When the halving happens in mid-May, supply will decrease while the demand is expected to remain the same. Theoretically, this should drive up the price. Bitcoin has halved twice before, once in 2012 and the second time in 2016. After the 2016 halving, price eventually rose to its all-time highs near $19,666 (however not immediately) before pulling back to $5,920 less than 2 months later. The halving is based on a mathematical equation. Given the current rate at which Bitcoin are mined, the date of the halving is roughly known, so are people buying ahead of it?
On a weekly timeframe, price had broken lower out of a symmetrical triangle during the week of March 9th, which proved to be a false break lower. Today, price moved back into the triangle. Often times, when we see a false break in one direction out of a triangle, price will move to test the other side of the triangle, which in this case is near $10,500.

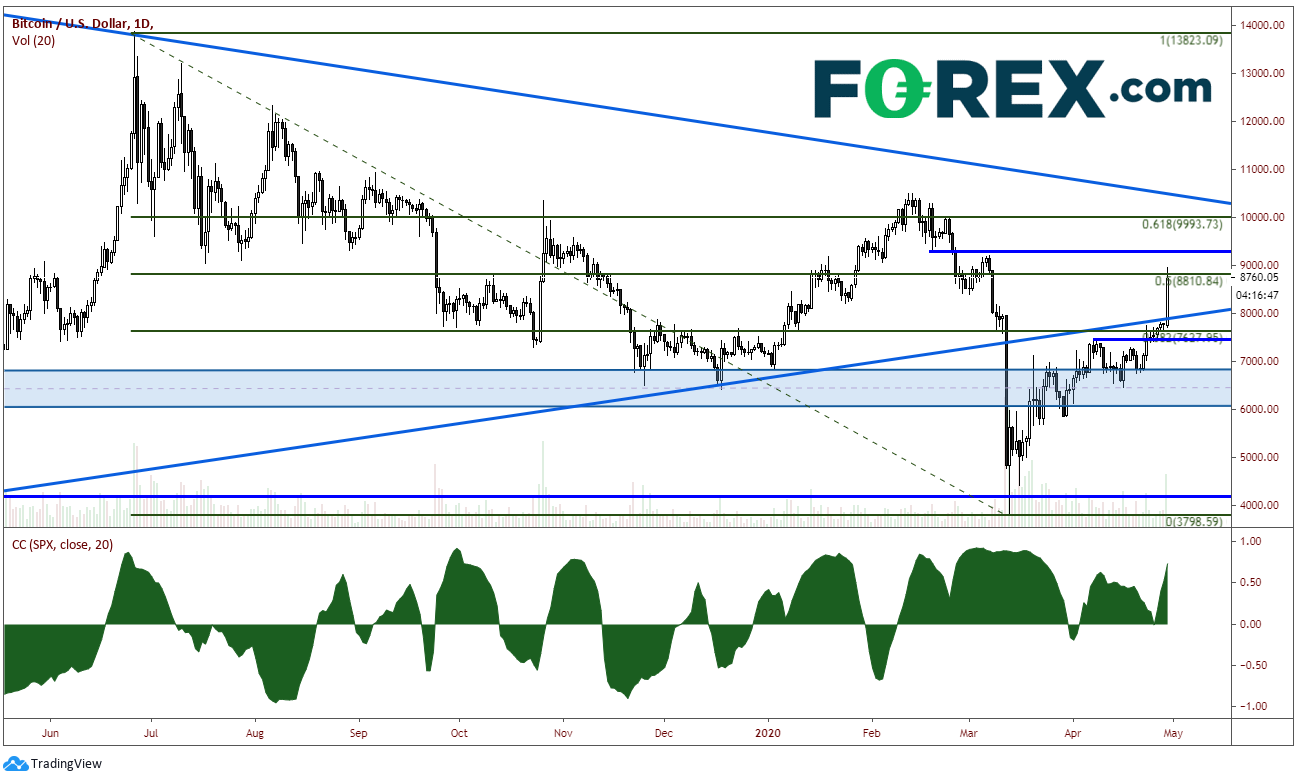
The other reason people have been talking about Bitcoin lately is because of its recent move higher with stocks. Wasn’t Bitcoin supposed to be a hedge to risky assets? Often during 2019, when stocks moved higher, Bitcoin moved lower. It was considered a “storage of wealth,” just like gold. However, as we can see from the correlation coefficient on a daily timeframe, during times of extreme volatility (such as the last 2 months) BTC has been a coincidental indicator. The crypto currency has been moving in tandem with stocks rather than opposite stocks.

As BTC moved higher back into the triangle yesterday, BTC halted right at the 50% retracement level from the highs of June 29, 2019 to the lows of March 20th near $8,810. There is also horizontal resistance at this level. Next horizontal resistance is at $9,400 and then the 61.8% Fibonacci retracement level from the previously mentioned timeframe near $9,994. Trendline support below at the $7,922 and then today’s lows of $7,717. Below that is horizontal support at $7,469.
Will BTC move higher? Well, if it is a buy-the-rumor, sell-the-fact move we are seeing into the halving, and the halving won’t take place for a few more weeks, then it could. Stocks also pushed through the 61.8% Fibonacci retracement today from the February 20th highs to the March 23rd lows. So, if BTC is following stocks, then it could. However, stocks are running into resistance between 2962 and 2973. If stocks turn lower from here, BTC could also move lower with them.
