The market seems to be taking a breather or waiting for news, as the price action today has been limited, with Bitcoin (BTC-eUSD) markets trading sideways today. At present, the Bitcoin price stands at $376.21, up 0.36% on today’s open. A low of $371 was reached but bounced back up from this level, which has held as strong support over the past week.The first weekly support lies at $363.45. The price action has tested the first monthly resistance level just under $394, but it has held for almost two weeks now. Looking forward, the range of prices should be $363-$393. An extended upward move is expected if the price action breaks above the monthly resistance.
The Finnish Central Board of Taxes (CBT) classified Bitcoin to be a financial service, whereby Bitcoin purchases qualify as ‘banking services’ under the EU Value Added Tax directive. This means that Bitcoin purchases are VAT exempt and by recognizing them as a payment instrument, Finland has made it more likely that Bitcoin will become a formal currency. Finland’s approach contrasts with other European nations who have treated Bitcoin as a commodity. However, the decision would not be welcomed by European central banks as it would create further regulation issues. The EU has no policy,as of yet, or joint digital currency framework. The response to the new technology and evaluation of Bitcoin from the EU has been relatively slow, leading individual nations to take a variety of approaches.
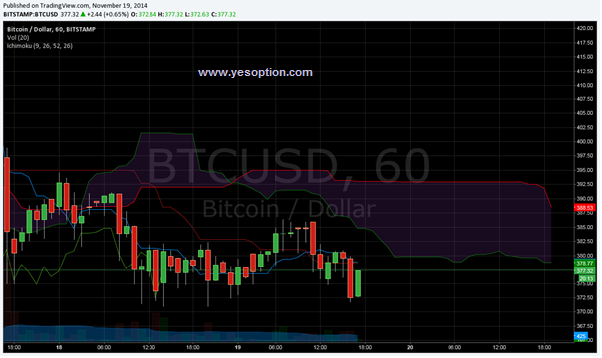
The hourly chart below shows the price action on the BitStamp exchange with the Ichimoku cloud. The price has trended lower today after encountering selling pressures just below the Ichimoku cloud. There was a brief moment of bullish momentum but this quickly fizzled out. The conversion line moved above the base line but the price has yet to test the resistance provided by the bottom part of the cloud. Going forward, the bottom part of the cloud should restrict any upward moves at $378. If the price breaks above this level, the next significant resistance lies at $392. The red cloud that has formed indicates a downward trend and the best strategy may be to sell the rallies, i.e. sell when the price touches or tests the cloud. The cloud projected ahead has started to move downwards, indicating potentially lower levels of resistance in the days ahead.

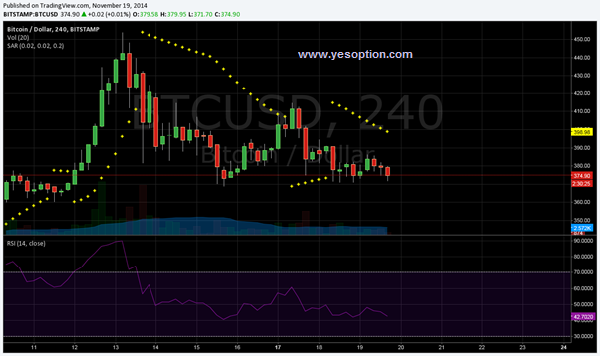
The chart below shows the price action at the 4 hour timeframe, along with the Parabolic Stop and Reversal and the Relative Strength Index. The Parabolic Stop and Reversal is above the price action, indicating a downward trend, which was indicated yesterday. The relative strength index (RSI) has moved below 50 today, giving further confirmation of a downward trend. The RSI currently stands at 42.7 and should move closer to the oversold zone at 30.0. A potential buying opportunity will be presented if the relative strength index pushes below 30 into the oversold zone and this opportunity will be more reliable if the Parabolic Stop and Reversal starts to appear below the price action, which indicates the start of an upwards trend.

