Bitcoin pushes past an important $11,000 resistance and takes aim for higher highs.
Key Takeaways
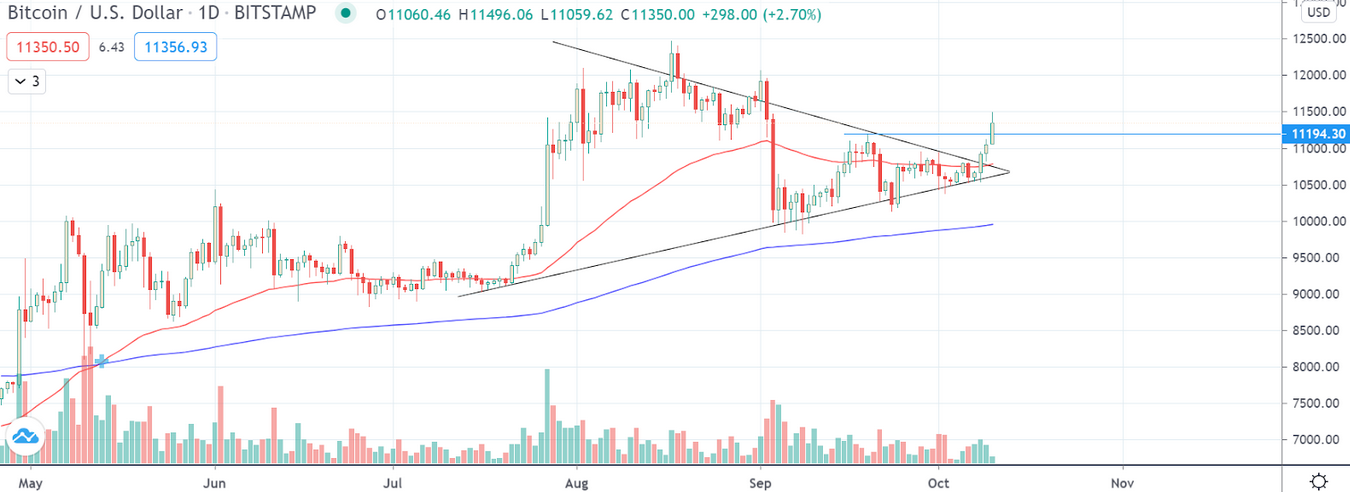
- Bitcoin has crossed the $11,100 resistance setting sights at $13,800.
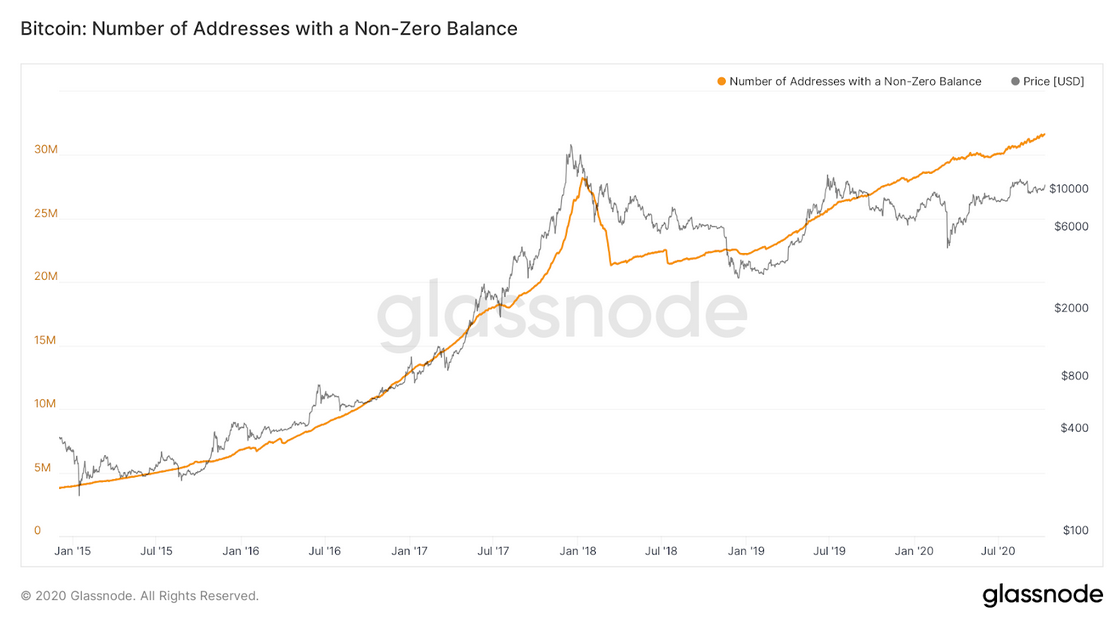
- The number of non-zero Bitcoin addresses made a new all-time high (ATH) with over 31.5 million addresses.
- On-chain and exchange activity for Bitcoin is also indicating further upside.
Bitcoin’s price has blown past $11,000, with a 6.53% increase in the last three days as anticipation of another bull run mounts. The move comes with the American elections just 23 days away.
Bitcoin’s Technical Breakout
Since the beginning of this month, BTC’s price has faced two major shocks with legal charges against BitMEX and the rift between U.S. President Donald Trump and the Federal Reserve on more monetary stimulus.
Nevertheless, resilient buyers held the price above support and took the hint from Square’s buy of $50 million BTC as a more trustworthy catalyst.
The top crypto price broke past resistance from the September month high at $11,200 and is now targeting the symmetrical triangle breakout at $13,800.

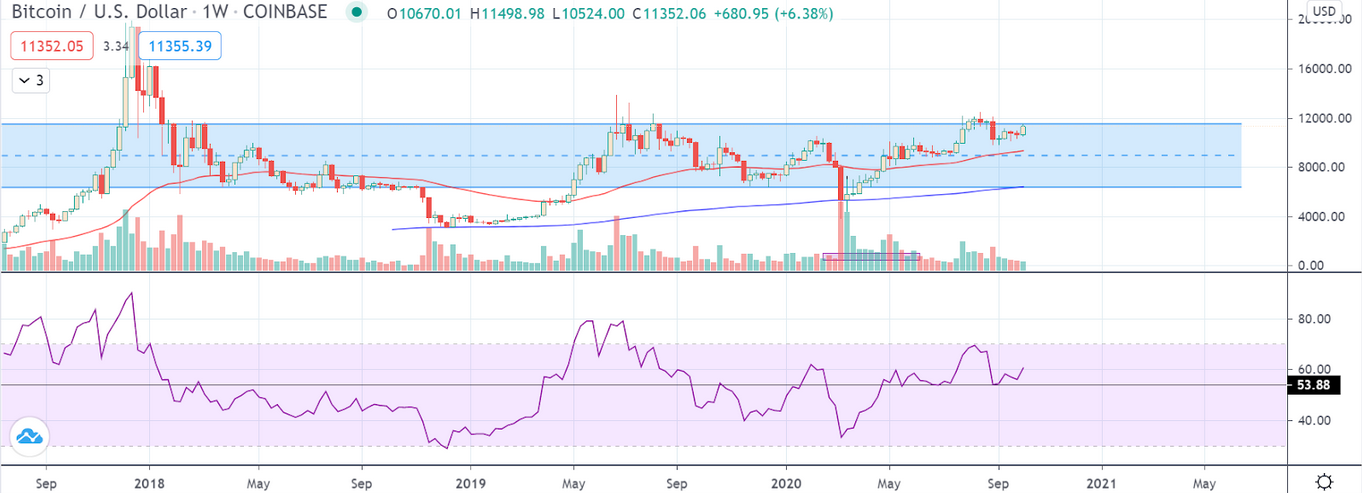
On the weekly scale, however, BTC price has met with the parallel resistance at $11,550. The relative strength index (RSI) indicator has entered the overbought region suggesting a correction might be due soon.

The RSI indicator measures the rate of the rise or drop in the price of an asset, helping investors identify whether the token is in the overbought, neutral, and oversold region from top to bottom.
RSI values range between 0-100, where levels above 70 are considered overbought and below 30 as oversold. However, during bull markets, BTC has been known to stretch RSI’s bullish limits up to 90. On a daily scale, the RSI is at 63, with more room to the upside.
Nathan Bachelor, the lead Bitcoin analyst for Crypto Briefing’s in-house research wing, SIMETRI, elaborated on BTC’s behavior:
“After weeks of patiently waiting, Bitcoin finally smashed through the $11,100 barrier. We decided to book profits on this trade at $11,340 today, as the breakout did not reach our initial target of $11,685. However, we did bank a healthy 10.31% return for our subscribers in just over three-weeks and caught the late-September pullback almost perfectly. Another reason we want to go flat at the moment is to prepare for our next big trade, which could come as soon as Monday.”
Bull Market Sentiments
The number of non-zero Bitcoin addresses continues to reach new highs almost every other day. Currently, there are over 31.5 million addresses that hold some amount of BTC in them.

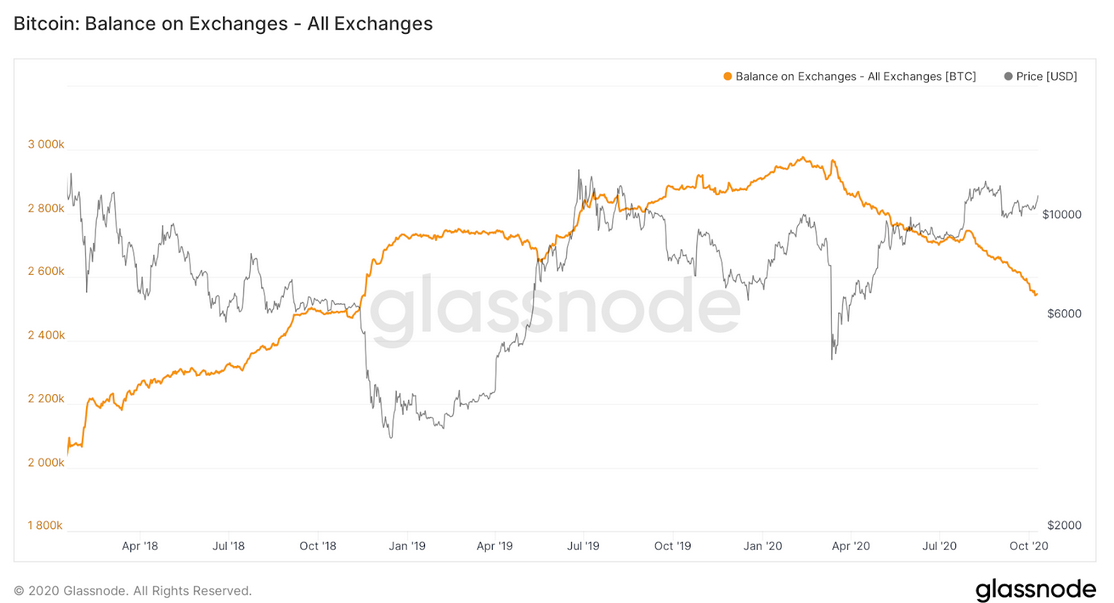
The Bitcoin balance on exchanges continues to drop, reaching parity with the levels from October 2019. This a bullish signal for the market. Leading on-chain analyst Willy Woo tweeted:
“When coins on spot exchanges drop, it’s a sign that new buyers are coming in to scoop coins off the markets and moving them into cold storage HODL, we are seeing new HODLers right now.”

Bitcoin’s strong recovery after the COVID-19 shock in March, the halving event in May, and uncertainty before the U.S. elections have all rejuvenated the market’s bullish sentiments.
