Get 40% Off
⚠ Earnings Alert! Which stocks are poised to surge?
See the stocks on our ProPicks radar. These strategies gained 19.7% year-to-date.
Unlock full list

Bitcoin Crashes. You’ll Be Surprised To Hear What’s Next

Published 09/04/2020, 03:41 PM
Updated 07/09/2023, 06:31 AM

RESEARCH HIGHLIGHTS:

  • Bitcoin collapsed near Triple Fib Amplitude Arcs – is this a sign of pending reversal for other assets?
  • It is very likely that Bitcoin price levels will fall below the May through July levels, near $9k in an attempt to identify new support levels. The $8k level would be the next downside price target. Beyond that, possibly $7k or even $6k.
  • Gold and Silver will move lower before going higher as a potential price collapse in Bitcoin suggests general market fear is hitting all global assets.
  • As other assets decline in valuation levels, the US dollar will likely be viewed as the strongest currency to own and rise.

Many of you are familiar with my team’s advanced study of Fibonacci Price Theory and our use of our proprietary Fibonacci Price Amplitude Arc indicators. This technical analysis theory is a combination of Nikola Tesla’s Mechanical Resonance theory and the traditional Fibonacci Price Theory. We believe the innate frequency of price action (once found), can be used to identify future critical inflection points in price. In this case with Bitcoin, three unique Fibonacci Price Amplitude Arcs aligned within 5 days to present a very real price inflection point. The recent collapse in the price of Bitcoin may be inherently related to the frequency of price from past peaks and troughs using our advanced Fibonacci Price Theory.

We found it interesting that Bitcoin prices stayed below $10k through most of June and July, when other Fibonacci Price Amplitude Arcs crossed price, then began to move higher after the last Price Amplitude Arc completed near July 20, 2020. After that Fibonacci Arc completed, the only Fibonacci Price Amplitude Arcs present in the future were the Triple Fibonacci Arcs shown on this Daily Bitcoin chart (below).

Our team also believes that once Bitcoin cleared the previous Fibonacci Arcs, a bit of a “reprieve” took place in price where a moderate upside price rally too place. As we neared the Triple Fibonacci Arcs, price activity muted and reversed. Could it be that price reacts to frequency levels we are not seeing on the charts?
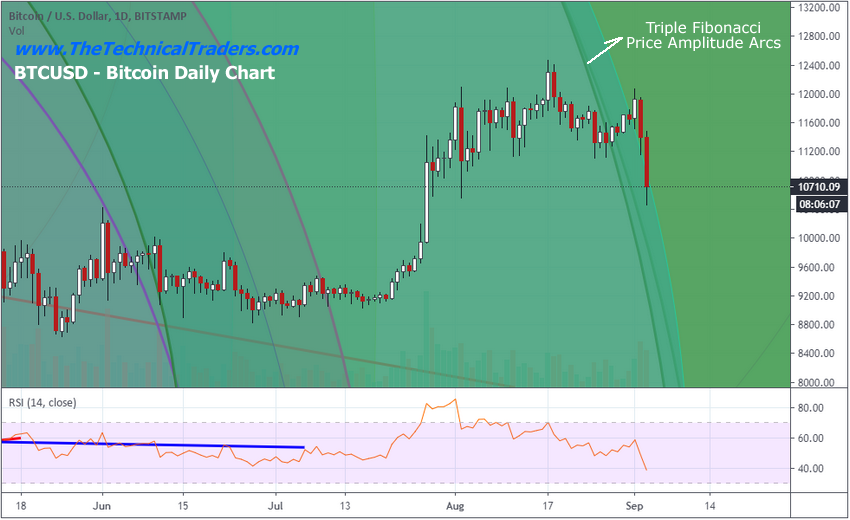
Bitcoin Daily Chart

The Weekly BitCoin chart, below, highlights many of the origination points (peaks and troughs) of the Fibonacci Price Amplitude Arcs. We anchor them to price peaks or troughs as a way to use and study them, measuring critical price waves (up or down) using Eclipse drawing tools, then drag them and anchor them to current or past peaks or troughs. Then we study the levels to determine if the frequency of price validity is accurate or not. If we believe we have drawn a Fibonacci Price Amplitude Arc that is valid, we’ll keep in on the chart for future reference.
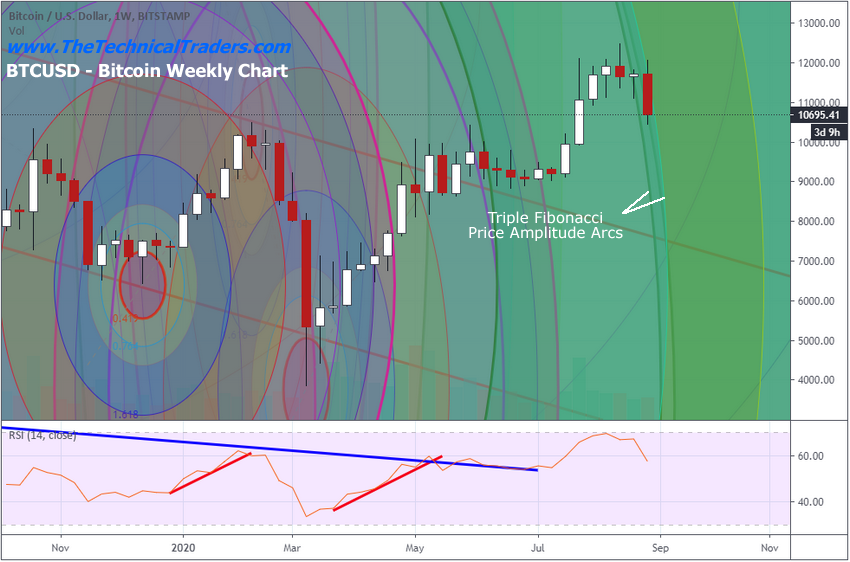
Bitcoin Weekly Chart

We believe this current Triple Fibonacci Arc pattern may be present in other symbols given how the US stock markets have reversed recently. It may be that these critical price inflection points operate across major indexes like tides in the ocean work across multiple ports and harbors. When a big or critical Fibonacci Price Amplitude Arc hits, we believe it results in a broad market reaction.

If this breakdown in Bitcoin Continues, the $8k level would be the next downside price target. Beyond that, possibly $7k and maybe as low as $6k. We will have to see how Bitcoin reacts to this Triple Fibonacci Price Amplitude Arc and how deep price corrects at this time. It is very likely that Bitcoin price levels will fall below the May through July levels, near $9k in an attempt to identify new support levels.

We also believe Gold and Silver will move lower as a price collapse in Bitcoin suggests the general market fear is hitting all global assets. The US dollar may attempt to form support as well because of this move. As other assets decline in valuation levels, some primary currency will likely be viewed as the strongest alternative asset – this will likely be the US dollar. Eventually, after what we believe could be a moderate downtrend in Gold and Silver, precious metals will begin to move dramatically higher as foreign currency and Bitcoin prices continue to fall. Capital will always seek out the best, least risky, investment solutions at times of chaos and risk. If Bitcoin becomes highly volatile and continues to fall, then alternate assets present very real opportunities.

Latest comments

Nailed it… Donkey
Franklin David How?
Old news ... very old news.
need to do better than what I am
how do I get in on it
Did you know that you can make up to 5,000trx in the next 3 hours ask me how
How
How?
how
No many 😂😂
WHAT IS THIS ARTICLE OF '2020, Sep 04' doing here ??  -- Please flag it or report it for deletion. -- IMO since Investing dot com has been taken over by China everything is getting neglected. Typical of what China represents: neglect and being out of touch with reality. -- Make no mistake: Everything that China displays now and up to their olympics in 2022 is all going to be SHOW, SHOW, PROPAGANDA, lies, fake, and more show. Don't be fooled by it.
Wrong
I'll be waiting for the future bright.
Old article, these people obviously had no clue. Bitcoin @ $62k 10-16-21.
how far
reading this in 2021 with BTC at 54k XD
let's see BTC at that price🙂
let's see BTC at that
looking good
sweet, let's see BTC at that price
that's fairly ambitious but I think 22,000 is a reasonable target. there are factors economically that will cause selling of crypto assets plus let's look at government control initiatives that are inevitable
awesome
good days sir please sir who can we rich here
dead on arrival
looking good sir
wow very nice
it's interesting to see from time perspective how wrong the TA has been (and Chris as well).  BTC is not an asset that should be evaluated by TA only, but primarily based on On-Chain analysis and tools.  Looks like the author is clueless what On-Chain Analysis is.  September'20 levels were a starting time for the whales to accumulate - and they accumulated heavily, up to Feb'21 (~$40k).  On-exchange vs. off-exchange analysis is the primary guide what's going to happen to BTC.  I would advise Chris to stay away from TA of BTC - it's useless.
yes, and stay away from TA in stocks as well. He is a charismatic person by looks and action but he is a PERMA BEAR on all things equity. == He made similarly useless predictions in 2016 and I, unfortunately, made some wrong purchases in the portfolio of my family with disastrous consequences. -- BEWARE, THIS MAN IS INCOMPETENT on T.A. matters.
good
good
I think Chris is dead on in his prognostications!!
Risk Disclosure: Trading in financial instruments and/or cryptocurrencies involves high risks including the risk of losing some, or all, of your investment amount, and may not be suitable for all investors. Prices of cryptocurrencies are extremely volatile and may be affected by external factors such as financial, regulatory or political events. Trading on margin increases the financial risks.
Before deciding to trade in financial instrument or cryptocurrencies you should be fully informed of the risks and costs associated with trading the financial markets, carefully consider your investment objectives, level of experience, and risk appetite, and seek professional advice where needed.
Fusion Media would like to remind you that the data contained in this website is not necessarily real-time nor accurate. The data and prices on the website are not necessarily provided by any market or exchange, but may be provided by market makers, and so prices may not be accurate and may differ from the actual price at any given market, meaning prices are indicative and not appropriate for trading purposes. Fusion Media and any provider of the data contained in this website will not accept liability for any loss or damage as a result of your trading, or your reliance on the information contained within this website.
It is prohibited to use, store, reproduce, display, modify, transmit or distribute the data contained in this website without the explicit prior written permission of Fusion Media and/or the data provider. All intellectual property rights are reserved by the providers and/or the exchange providing the data contained in this website.
Fusion Media may be compensated by the advertisers that appear on the website, based on your interaction with the advertisements or advertisers.
© 2007-2024 - Fusion Media Limited. All Rights Reserved.