
Year-to-date, bitcoin is still up 55% against the USD. But 2021 has already been quite a rollercoaster for the crypto sector. And it looks like this roller coaster is going to shift up another gear.
Review
Since the new all-time high around US$65,000 on April 14th, 2021, Bitcoin has already been in a correction. In the first weeks after this all-time high, however, the crypto community still lulled itself into security, as Bitcoin consolidated sideways between US$47,000 and US$60,000, while Ethereum and numerous other altcoins still stormed to new record highs until May 10th (“altcoin season”).
However, a sharp correction wave then quickly threw Bitcoin prices down to around US$29,500. Subsequently, a two-month bottoming occurred until mid-July, whereby a slightly lower low was seen again at US$28,500. This represented a sell-off in the range of -56% from the new all-time high! On the basis of a completely depressed sentiment with very high panic values, a huge short squeeze finally started July 20, which catapulted Bitcoin prices up by more than 80% within only seven weeks to the 61.8% retracement and beyond to US$52,950, as suspected. Most altcoins followed suit in this rally, with some select coins like Solana and Cardano even reaching new record highs. Ethereum, on the other hand, fell short of its all-time high, just like Bitcoin, despite a 134% rally.
JPGmania, Evergrande And Fantasia Holdings
Since then, there has been a new wave of corrections in the last three weeks. In the process, Bitcoin prices already fell back to US$39,650 and Ethereum to US$2,650. Despite this overall sobering performance in recent months, optimism in the sector remains relatively high. The hype around the so-called NFTs (non-fungible tokens) in particular took on absurd traits. Generally, NFTs are certainly an exciting development with high potential for the future. But in view of the absurdly high amounts that were recently paid for generally pathetic digital images, one must clearly speak of a “JPGmania.”
All in all, the Bitcoin rally has either “only” been interrupted since April 14 or has ended back then, and the sector is already in a crypto winter. On top of this situation, which is unclear in itself, now the collapse of the real estate bubble in China becomes more apparent.
Technical Analysis For Bitcoin In U.S. Dollar

Bitcoin in USD, weekly chart as of September 28th, 2021. Source: Tradingview
In recent months, the Bitcoin rally has stalled. So far, the weekly chart sets the scene for a consolidation at a high levels. However, the lower high at US$52,950 does not bode well. Only with imagination and a lot of optimism, a larger consolidation triangle (dashed in light blue) can be constructed. This could be resolved bullishly to the upside. However, this pattern is far from being confirmed.
Clearly unfavorable, however, is the fresh stochastic sell signal on the weekly chart. The oscillator has only recently turned south and could need many weeks for the way to the oversold zone. Thus, the support zone between approx. US$38,000 and US$41,000 USD is probably already of decisive importance. Because the more often the bears attack here, the more fragile this support becomes. A bearish breakthrough would then have to be countered by the bulls rather immediately and at the very latest in the area around US$34,500 to US$35,500. Otherwise, the path back towards US$30,000 USD is already marked out, which, however, would cloud the big picture considerably.
Overall, the weekly chart can still be classified as halfway neutral within a large sideways consolidation. However, the matter does not look good anymore and one already wonders where all crypto investors actually take their optimism from these days. If Bitcoin falls below the low from the previous week at US$39,525, the situation turns to red alert! Only with Bitcoin prices back above US$51,000 USD do the probabilities for a continuation of the rally increase significantly again.

Bitcoin in USD, daily chart as of September 28th, 2021. Source: Tradingview
On the daily chart, the last high at US$52,950 has created a new downtrend line, which should be the measure of all things for Bitcoin on the upside from now on. Together with the 61.8% retracement at US$51,030, the zone between currently around US$50,000 and US$51,000 is, thus, hard resistance. But already the slightly falling 200-day moving average (US$45,505) could not be defended by the bulls lately. No clear decision has been made here yet, but the longer the price action moves below this moving average, the more the 200-day moving average becomes a resistance. The Stochastic Oscillator is drifting south, but has not yet reached the oversold zone. The technical picture is, therefore, becoming increasingly cloudy on the daily chart.
In summary, the daily chart is in a downtrend and, thus, bearish. So far, it went south in two thrusts during the last three weeks. Due to the two built-in intermediate recoveries, an oversold situation has not yet emerged. Instead, the Stochastic Oscillator still has room to move down, so price targets in the US$35,000 to US$38,000 range do look realistic over the next one to four weeks.
Sentiment Bitcoin – Chinese House Of Cards Is Collapsing
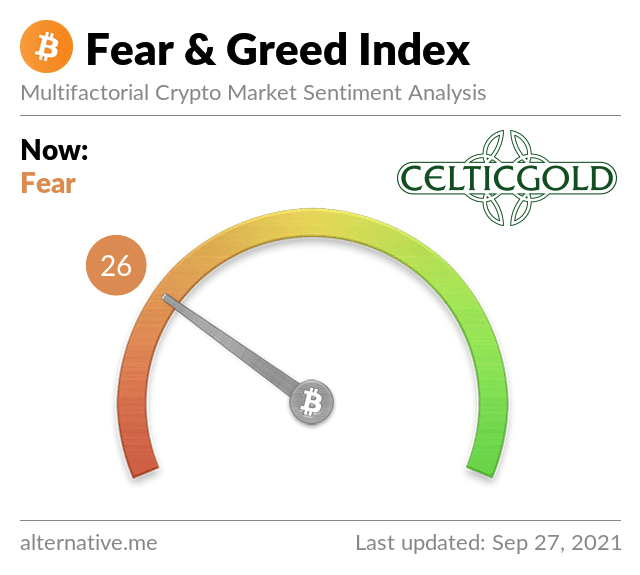
Crypto Fear & Greed Index as of September 27th, 2021. Source: Crypto Fear & Greed Index
Due to the sell-off of the last three weeks, the sentiment has slipped a good bit again. However, extreme panic is certainly not (yet) to be observed.
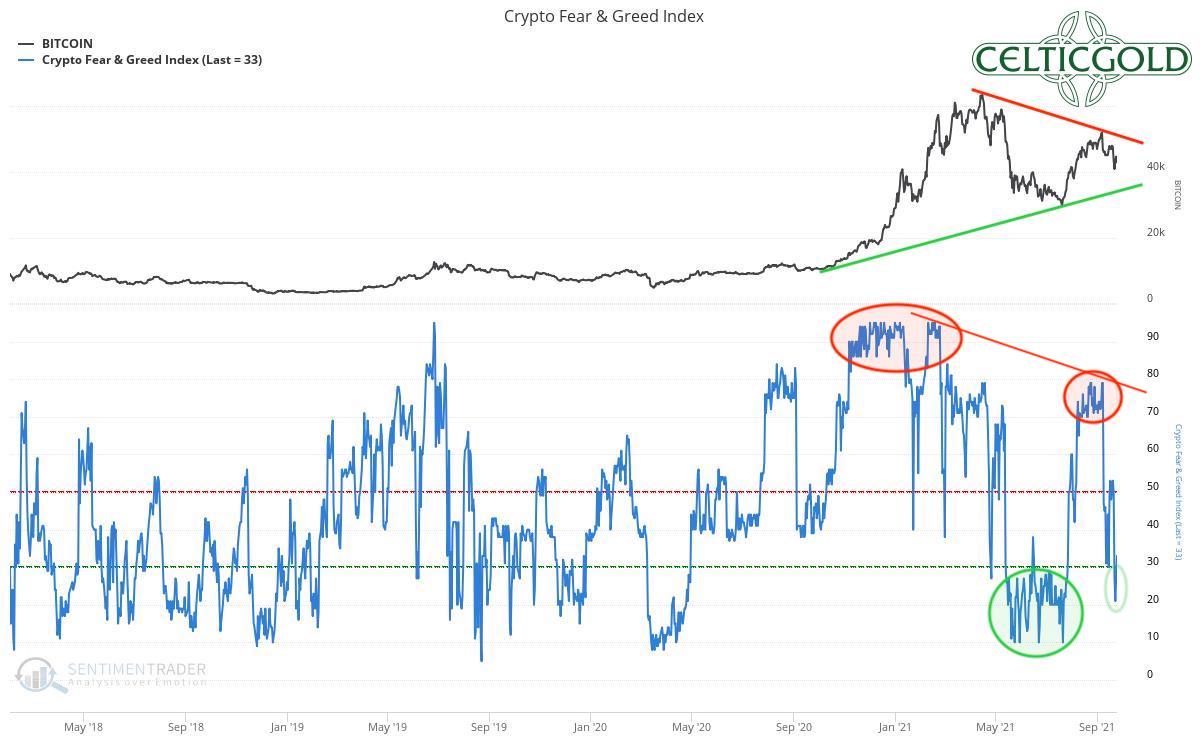
Crypto Fear & Greed Index long-term as of September 26th, 2021. Source: Sentimentrader
From a medium-term perspective, Bitcoin sentiment has experienced a true roller-coaster ride in recent months. After the total euphoria at the beginning of the year and a continued excessive greedy sentiment into May, nerves were particularly tested in June and July with the sharp correction. Classically, from this beaten down sentiment at the end of July, a huge short-covering rally emerged into September. This, in turn, created exaggerated optimism once again.
All in all, the crypto sector seems to be on its way to the next panic low. However, it will probably take more sell-offs until a trend change due to extremely negative sentiment can develop. Moreover, the optimists have been losing momentum since the beginning of the year. Hence, sentiment may have to settle in the basement for a longer period of time, which, in turn, would argue for an extended and deep correction.
Sound Money: Bitcoin Versus Gold

Bitcoin/Gold-Ratio as of September 28th, 2021.Source: Tradingview
At prices currently around US$41,700 USD for one Bitcoin and US$1,742 USD for one troy ounce of gold, the Bitcoin/Gold-Ratio did trade at 23.91, which means that you had to pay almost 24 ounces of gold for one Bitcoin. Put another way, one troy ounce of gold did cost about 0.0417 Bitcoin. Compared to the highs in March and April, Bitcoin had initially lost over 56% against gold. From mid-May, the Bitcoin/Gold-Ratio consolidated sideways for two months. Subsequently, however, bitcoin decimated gold once again with its sharp rally. However, the April high was clearly missed, hence a possible trend reversal in favor of gold would now be possible. For this, however, the steep uptrend channel would have to be broken to the downside. If this succeeds, considerable recovery potential opens up for gold against Bitcoin. And if only because gold falls significantly less than bitcoin.
You Want To Own Bitcoin And Gold
Generally, buying and selling Bitcoin against gold only makes sense to the extent that one balances the allocation in those two asset classes! At least 10% but better 25% of one’s total assets should be invested in precious metals physically, while in cryptos, and especially in Bitcoin, one should hold at least between 1% and 5%. If you are very familiar with cryptocurrencies, you can certainly allocate much higher percentages to Bitcoin on an individual basis. For the average investor, who is primarily invested in equities and real estate, a maximum of 5% in the still highly speculative and highly volatile Bitcoin is a good guideline.
Overall, you want to own gold and Bitcoin, since opposites complement each other. In our dualistic world of Yin and Yang, body and mind, up and down, warm and cold, we are bound by the necessary attraction of opposites. In this sense, you can view gold and Bitcoin as such a pair of strength. With the physical component of gold and the pristine digital features of Bitcoin you have a complementary unit of a true safe haven for the 21st century. You want to own both! – Florian Grummes
Currently, however, investors have to prepare for temporary price losses in all asset classes. These will be more severe in Bitcoin and milder in gold.
Macro Update: Bitcoin – The Chinese House Of Cards Is Collapsing
While the central banks continue to inflate their balance sheets and, thus, their currency volumes on a weekly basis, the U.S. Fed in particular has been bluffing the markets with its “tapering” and “normalization” talk. If we interpret the signs of the time correctly, however, the markets will not call the bluff, because in view of the upheavals in China, the Fed will row back by itself.
Since the financial crisis of 2008, China has grown at an incredible speed, becoming one of the biggest global players. During this process, billions of USD have flowed into China over the past 15 years. The massive migration from the countryside to the city as well as the spirit of optimism there based on the market reforms introduced by Deng Xiaoping in combination with the huge worldwide stimulus triggered an unprecedented boom that also pulled the Western world out of the quagmire of the financial crisis.
In Communism There Is No Swarm Intelligence Of The Free Market
In a centralist (= socialist, = communist, = totalitarian) run economy, however, financial resources and production goods are not efficiently distributed according to supply and demand. Instead, they are redistributed centrally at the bureaucrat’s desk without the intelligence of the free market. Thus, the local party bosses have increasingly channelled the constant growth targets from the far-away party headquarters in Beijing into the real estate sector. This in the blind hope of generating the desired and predetermined growth. This went well for years and boosted the global economy. Of course, Western financial institutions were also heavily involved in the financing and credit bundling. The ever increasing real estate prices created a self-reinforcing effect so that an ever larger house of cards could be built based on the increased land prices.
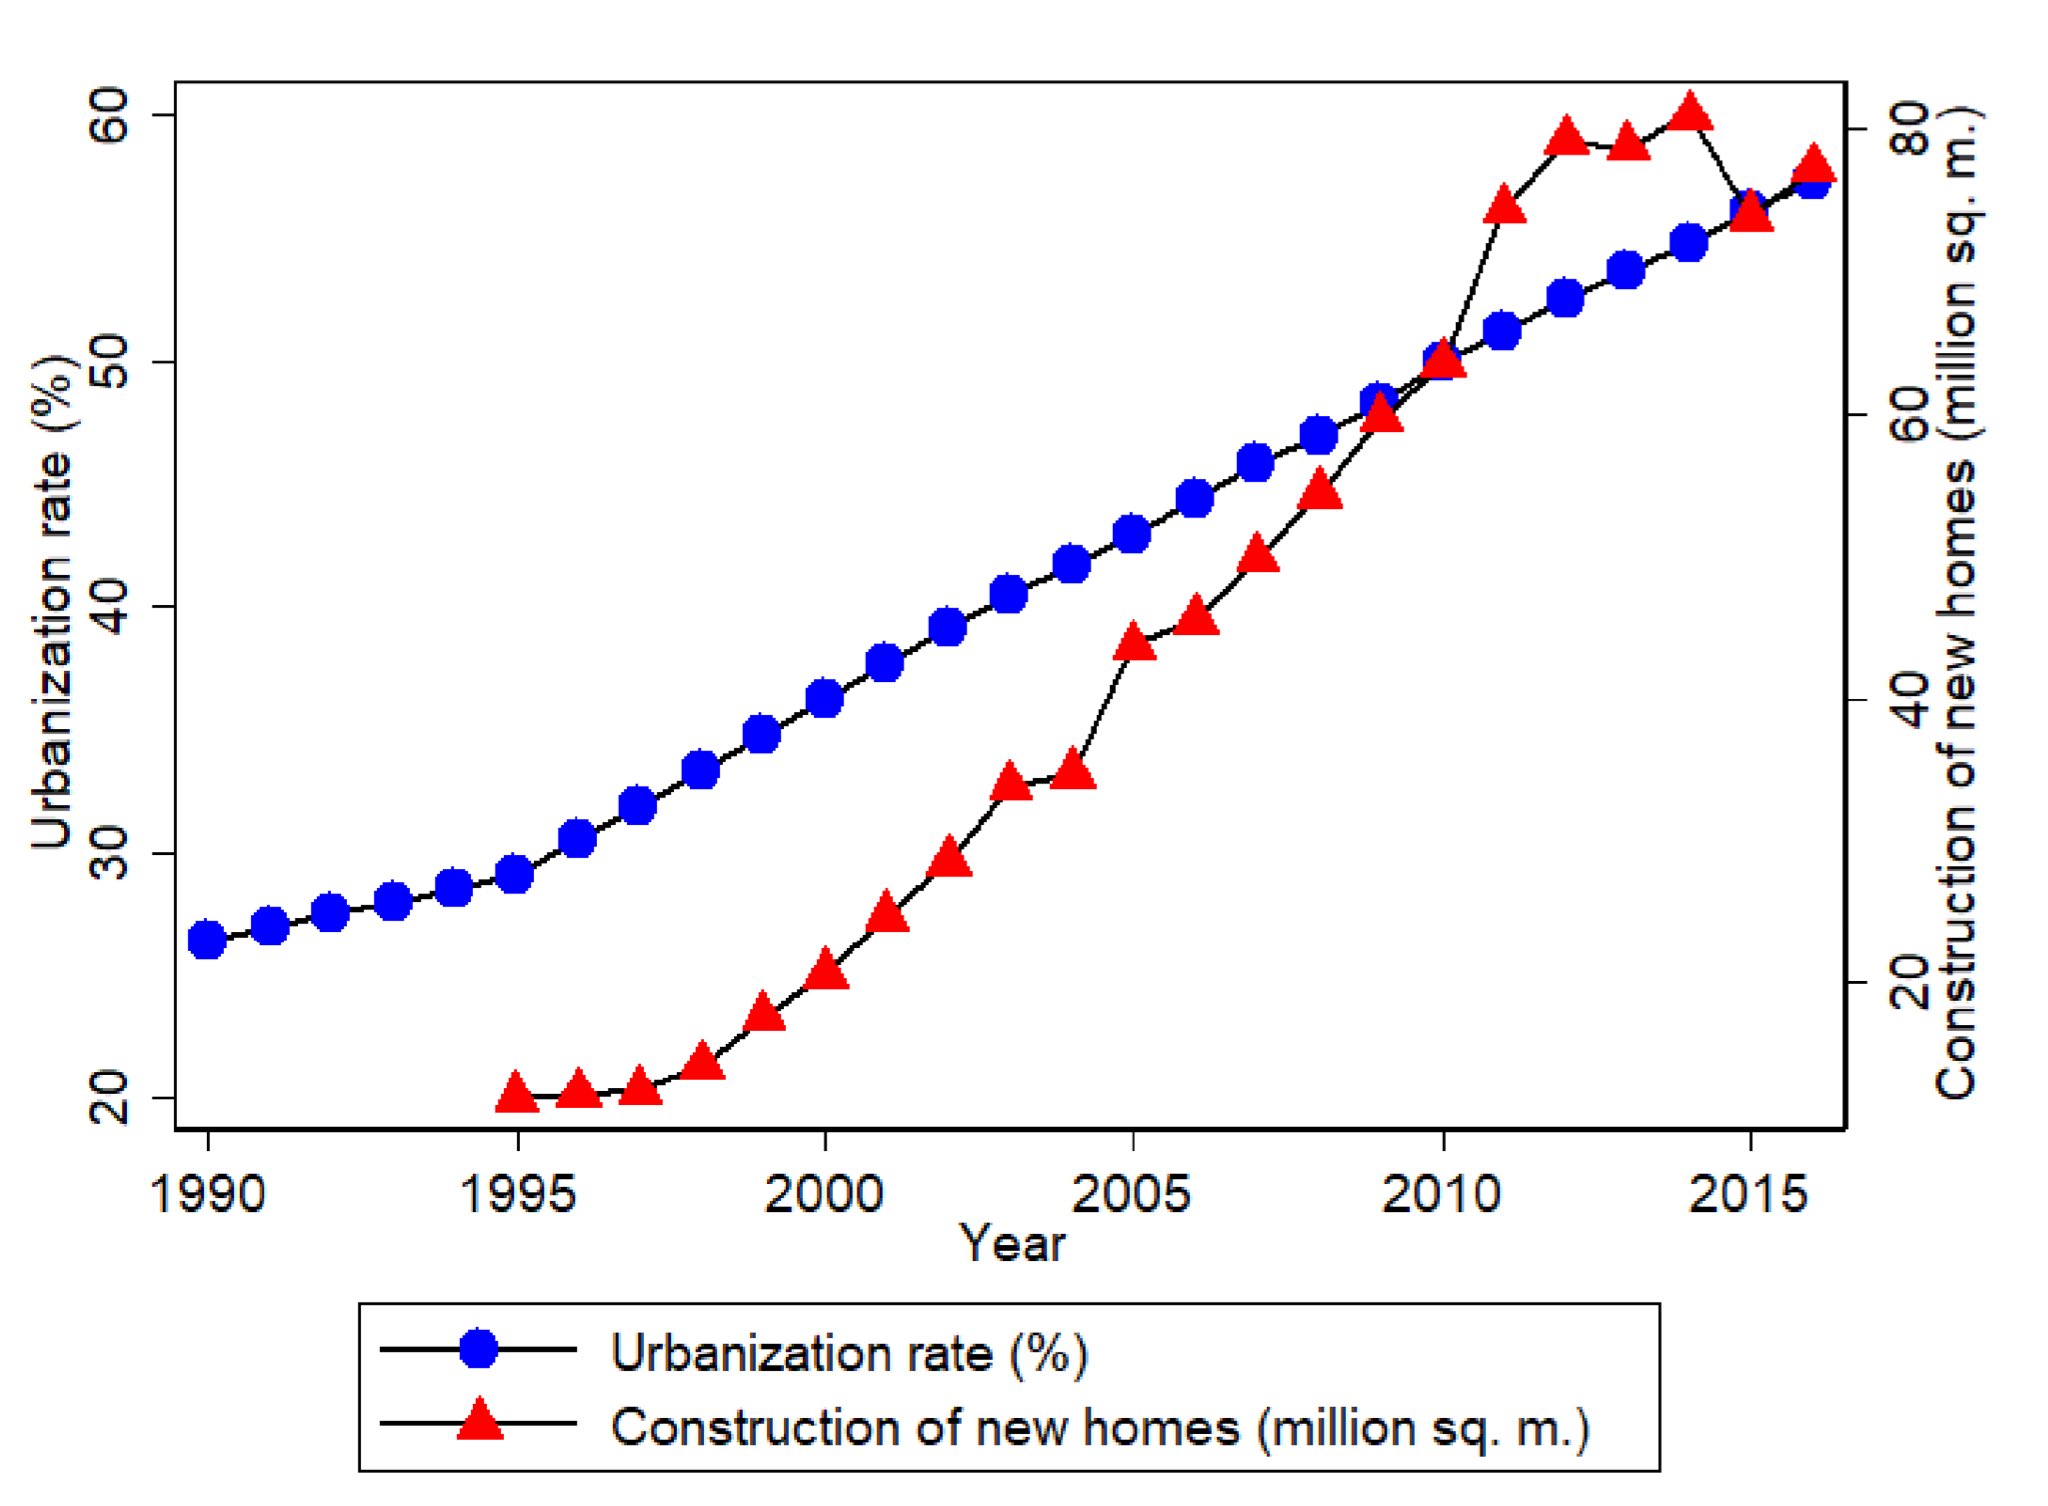
China Urbanization vs. Construction.
Images of so-called ghost cities have been circulating for several years, yet the real estate boom, which accounts for at least 25% of China’s economy, went on and on. Malinvestments, corruption, fraud and extreme leverage may have been the order of the day there. But with the now apparent bankruptcy of Evergrande, which has been stewing for over a year, the party is over. There is a high risk of contagion and global consequences are becoming increasingly likely. The highly indebted real estate sector in China is too convoluted.
We must assume that further collapses are imminent and that foreign investors in particular will have to write off their loans. This awakening in the western world will have dramatic consequences, especially since we will now have to realize that for years we have financed a fake house of cards with billions of USD. In the end, only empty high-rise deserts, ghost cities and unfinished construction sites may remain. The question is no longer whether Evergrande is “too big to fail,” but whether the Chinese real estate sector is possibly “too big to be saved.”
All Markets Will Be Hit By “Risk-Off Mentality
All markets will be hit by a “risk-off mentality” and only the U.S. dollar will be the safe haven in this environment, at least temporarily. Gold and the correction in Bitcoin that has been under way since April, are already painting this picture. However, central bankers will react in panic to the foreseeable collapses, and their predictable rescue measures will likely dwarf anything we have seen so far. At the least, once Special Drawing Rights (SDRs) come into play, the price action can abruptly turn from strongly deflationary to strongly inflationary.
Investors in all asset classes are in for a dizzying roller-coaster ride. One is well advised to reduce any risk at the moment and to hold sufficient cash reserves as well as physical gold and silver. Bitcoin has yet to prove how it performs in such a situation. As a risk-on asset and given the high leverage in the crypto sector, it might be a painful period until central bankers start flooding the markets.
Conclusion: The Party Is Over, Risk-Off!
The crypto sector has come under heavy attack from the Chinese Communist Party in recent years. The mining ban in June finally caused consequences and put a lot of pressure on Bitcoin prices. Now, China has attacked ASIC chip-makers as well. At least, this brings an end to the decade-long discussion about hash-rate concentration in China. In the medium and longer term, this should make the Bitcoin network much more decentralized and robust. Many of the miners or their mining equipment have already migrated from China to other countries.
In the U.S., however, there is a threat of a significant tightening of regulation by the federal government. In the short term, this potentially creates further pressure in a market that is already battered anyway.
The macro situation is undoubtedly highly complex and difficult to understand. However, the fact is that Bitcoin has technically been in a correction since April. At the same time, there are increasingly huge shockwaves coming from China due to the collapse of the real estate sector as well as the massive attacks by the central government on Bitcoin itself. In the U.S., heavy regulation is likely being introduced against stable coins and the crypto sector in general.

Bitcoin-Future in USD, weekly chart as of September 28th, 2021. Source: Tradingview
Overall, it is, therefore, likely that Bitcoin will soon sail or crash one floor lower. The next support sits around US$35,000 and has to hold. If it proves to be just a transit station, the crypto sector will be in trouble. In the Bitcoin future, the open price gap between US$24,605 and US$26,080 is still waiting. Overall, we currently assume at least a pullback to US$35,000, but also consider a much deeper correction to be very possible. We recommend highest caution and a “risk-off mentality” for now. Should the evidence change we will shift back to risk-on, of course.