
Bitcoin Cash recently caused a stir due to the hash-war between self-proclaimed Satoshi Nakamoto Craig Wright and Roger Ver, the owner of the domain Bitcoin.com. After the hard-fork on 15th November, there are two chains left for Bitcoin Cash: Bitcoin Cash ABC and Bitcoin SV. Without further ado, let’s have a look at both chains from a technical point of view.
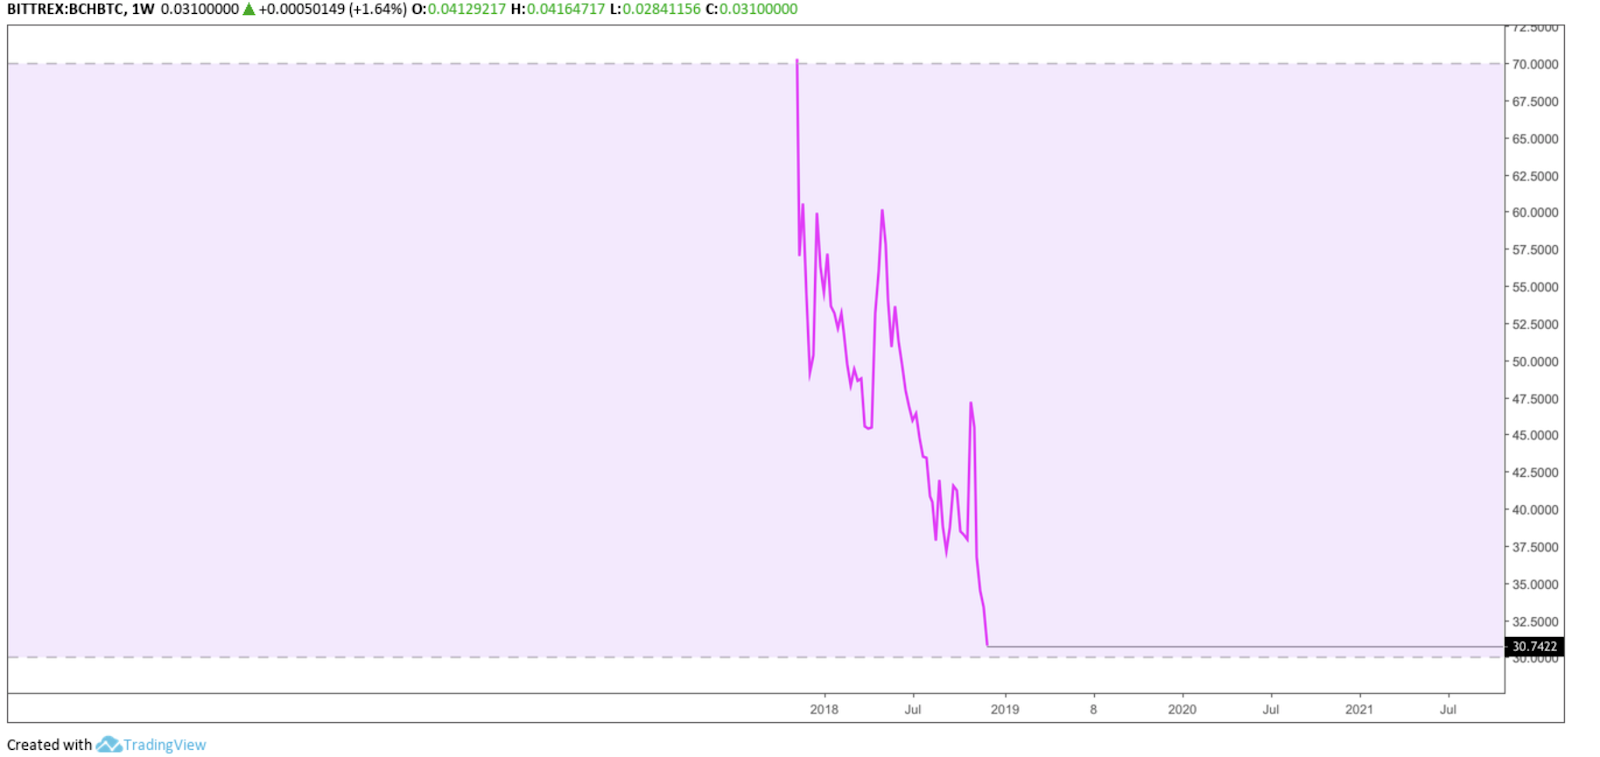
BCH/BTC WEEKLY CHART

Bitcoin Cash reached its peak in the first day of its launch on first August 2017 with being valued at 0.48697 BTC per 1 BCH. Since then, Bitcoin Cash is in a continuous downward spiral, losing 94.15 percent to date.
BCH/BTC DAILY CHART

The chart indicates no trend reversal, In fact, the enormous increase in volume during the recent 70.83 percent decline is a very bearish sign and indicates that large amounts of Bitcoin Cash ABC were sold in a short period of time.
BCH/BTC WEEKLY CHART
The Relative Strength Index indicates a correction movement towards the upside, with being only 0.742 points away from touching oversold regions. This, however, seems to be the last and only hope for a small upward movement in the near future for Bitcoin Cash ABC.
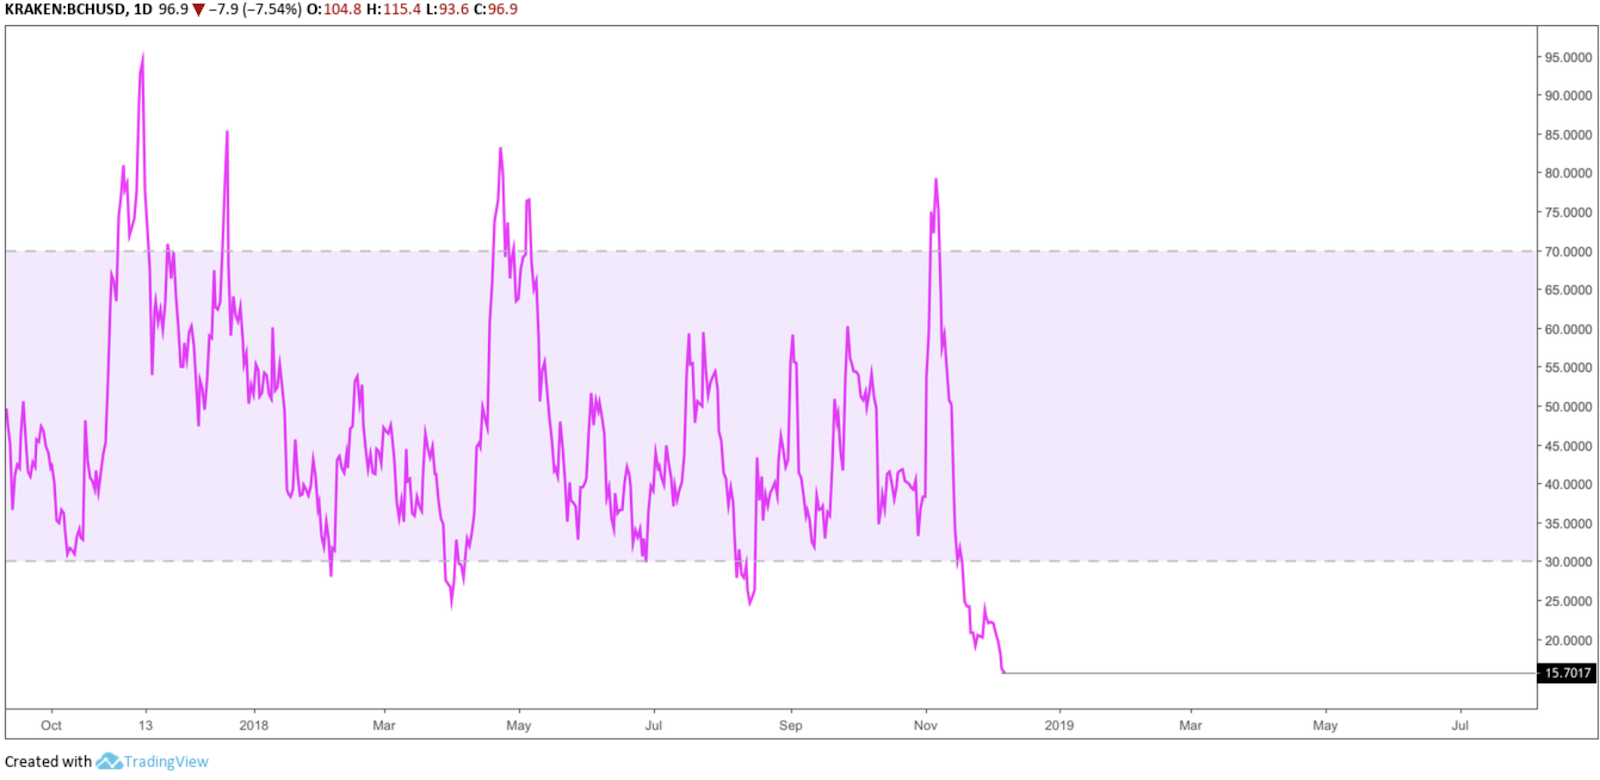
BCH/USD DAILY CHART

Bitcoin Cash ABC versus USD is in a bearish channel and only 12.32 percent distant from its channel support. With the current outlook, it seems like BCH will reach this trendline support before a correction takes place.
BCH/USD DAILY CHART
With the RSI as low as 15.7017 BCH, it is in strong oversold regions which indicates a correction wave to the upside is about to come in the not too distant future.
BCH/USD DAILY CHART
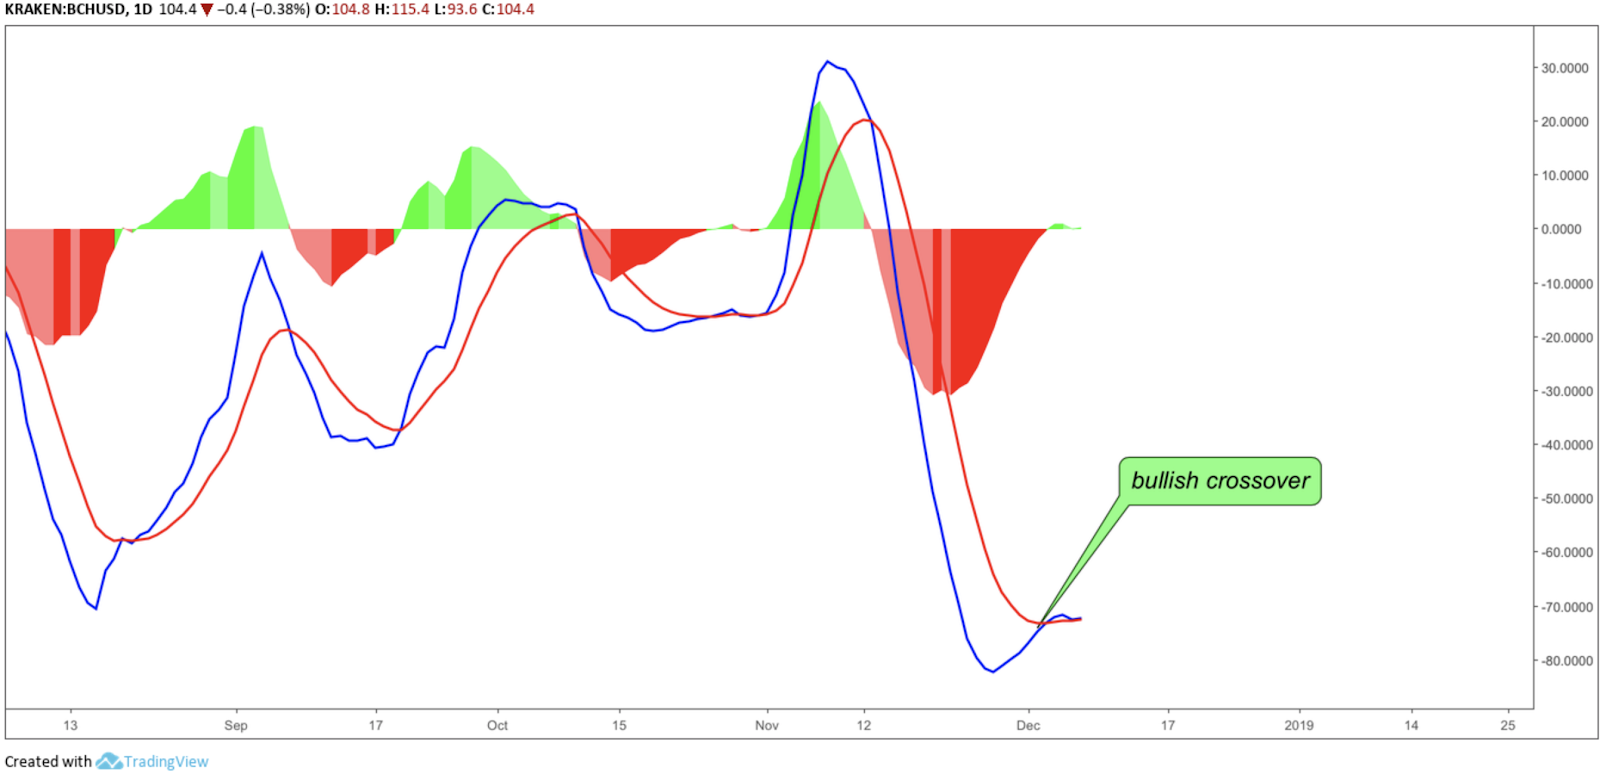
Additionally, the Moving Average Convergence Divergence - MACD recently crossed bullishly and is located in very low regions. However, the MACD is about to cross again which could deny the prior crossover.
BTC-SV/BTC DAILY CHART
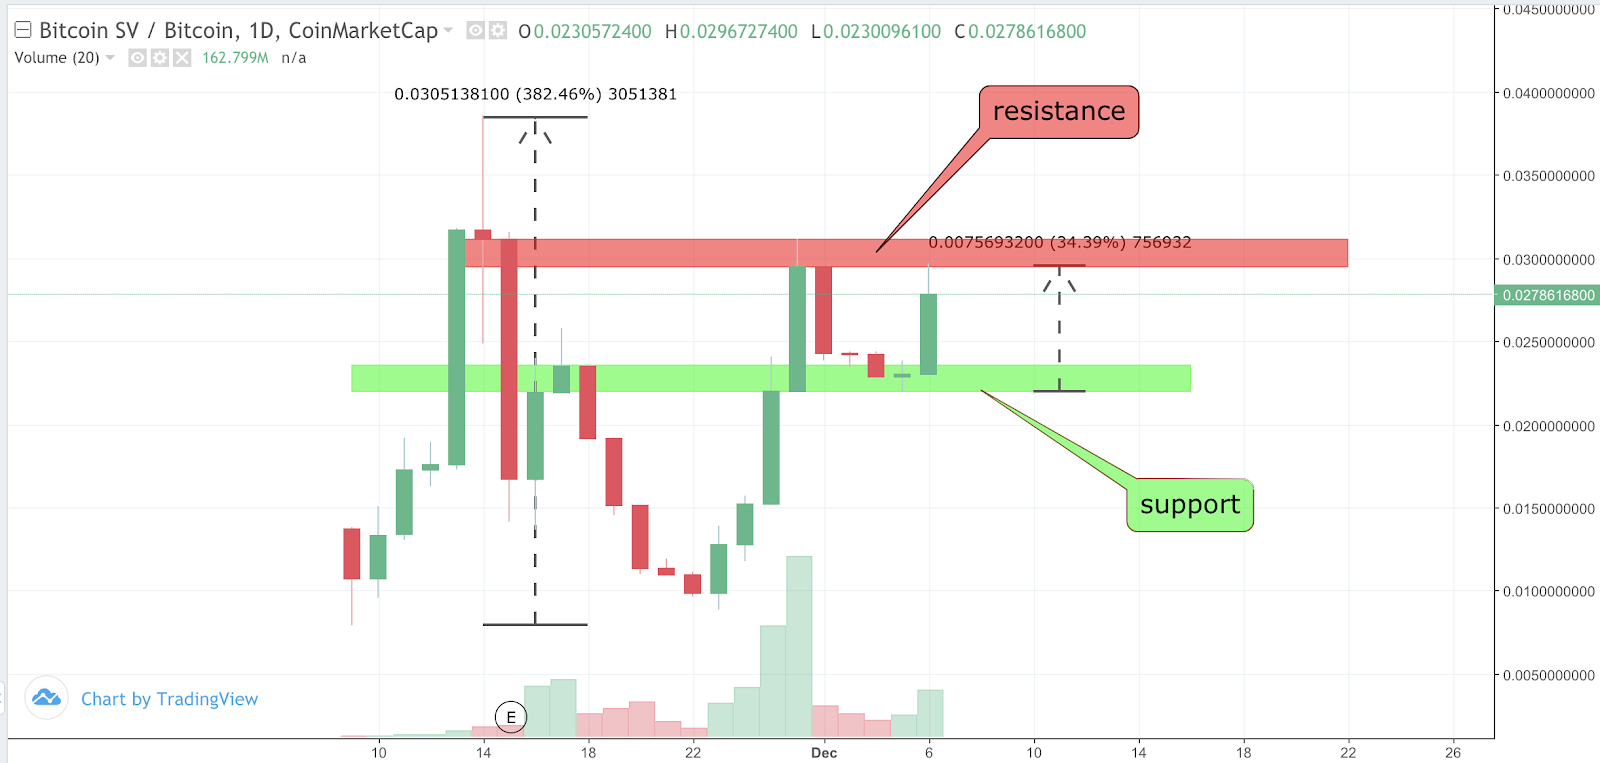
After the first trading week on exchanges, Bitcoin cash fork SV surged incredibly 382.46 percent. After almost coming back to its starting point, it rallied again 246.09 percent close to the previous high’s candle close, where it faced rejection and declined by almost 30 percent. However, it found support at 0.022 BTC and rose again by 34.39 percent, where it faced rejection again which resulted in a loss of six percent. Having said that, to continue the upward trend for Bitcoin SV, it has to break the resistance between 0.295 and 0.311 BTC. Otherwise, it will find its support at 0.022 BTC again.
To summarize, the future for the Bitcoin rival doesn’t seem too bright, at least from a technical point of view. Considering BCH was worth $4044 on 21th of December in 2017 and now it’s valued at $95, the prospects for investors might be shocking. However, experts on the field like Dominik Zynis, co-founder & head of marketing and communication at Wings Foundation, commented on the situation:
“Bitcoin could see the $1000-2000 range in 2019; bitcoin cash SV could take away some of the community and hence money velocity that props up the value.
The bear trend for Bitcoin will most likely continue through 2019 and might show correlations with the general bear market in stock equity.
For Bitcoin to go up again it needs certain conditions: a lot more use and adoption, a major recession that causes some govt backed currencies to crumble, or some type of war which makes an international transfer of funds more difficult.”
BCH/BTC WEEKLY CHART
Bitcoin Cash reached its peak in the first day of its launch on first August 2017 with being valued at 0.48697 BTC per 1 BCH. Since then, Bitcoin Cash is in a continuous downward spiral, losing 94.15 percent to date.
BCH/BTC DAILY CHART
The chart indicates no trend reversal, In fact, the enormous increase in volume during the recent 70.83 percent decline is a very bearish sign and indicates that large amounts of Bitcoin Cash ABC were sold in a short period of time.
BCH/BTC WEEKLY CHART
The Relative Strength Index indicates a correction movement towards the upside, with being only 0.742 points away from touching oversold regions. This, however, seems to be the last and only hope for a small upward movement in the near future for Bitcoin Cash ABC.
BCH/USD DAILY CHART
Bitcoin Cash ABC versus USD is in a bearish channel and only 12.32 percent distant from its channel support. With the current outlook, it seems like BCH will reach this trendline support before a correction takes place.
BCH/USD DAILY CHART
With the RSI as low as 15.7017 BCH, it is in strong oversold regions which indicates a correction wave to the upside is about to come in the not too distant future.
BCH/USD DAILY CHART
Additionally, the Moving Average Convergence Divergence - MACD recently crossed bullishly and is located in very low regions. However, the MACD is about to cross again which could deny the prior crossover.
BTC-SV/BTC DAILY CHART
After the first trading week on exchanges, Bitcoin cash fork SV surged incredibly 382.46 percent. After almost coming back to its starting point, it rallied again 246.09 percent close to the previous high’s candle close, where it faced rejection and declined by almost 30 percent. However, it found support at 0.022 BTC and rose again by 34.39 percent, where it faced rejection again which resulted in a loss of six percent. Having said that, to continue the upward trend for Bitcoin SV, it has to break the resistance between 0.295 and 0.311 BTC. Otherwise, it will find its support at 0.022 BTC again.
To summarize, the future for the Bitcoin rival doesn’t seem too bright, at least from a technical point of view. Considering BCH was worth $4044 on 21th of December in 2017 and now it’s valued at $95, the prospects for investors might be shocking. However, experts on the field like Dominik Zynis, co-founder & head of marketing and communication at Wings Foundation, commented on the situation:
“Bitcoin could see the $1000-2000 range in 2019; bitcoin cash SV could take away some of the community and hence money velocity that props up the value.
The bear trend for Bitcoin will most likely continue through 2019 and might show correlations with the general bear market in stock equity.
For Bitcoin to go up again it needs certain conditions: a lot more use and adoption, a major recession that causes some govt backed currencies to crumble, or some type of war which makes an international transfer of funds more difficult.”