So far, 2018 is definitely not what crypto investors were hoping for. The entire cryptocurrency market crashed yesterday as each coin lost between 15% and 40% of its market capitalization. Bitcoin, the biggest virtual currency out there, could not escape the bloodbath, as well. BTC/USD fell to an intraday low of $10 162 for a total daily decline of 25% on January 16th.
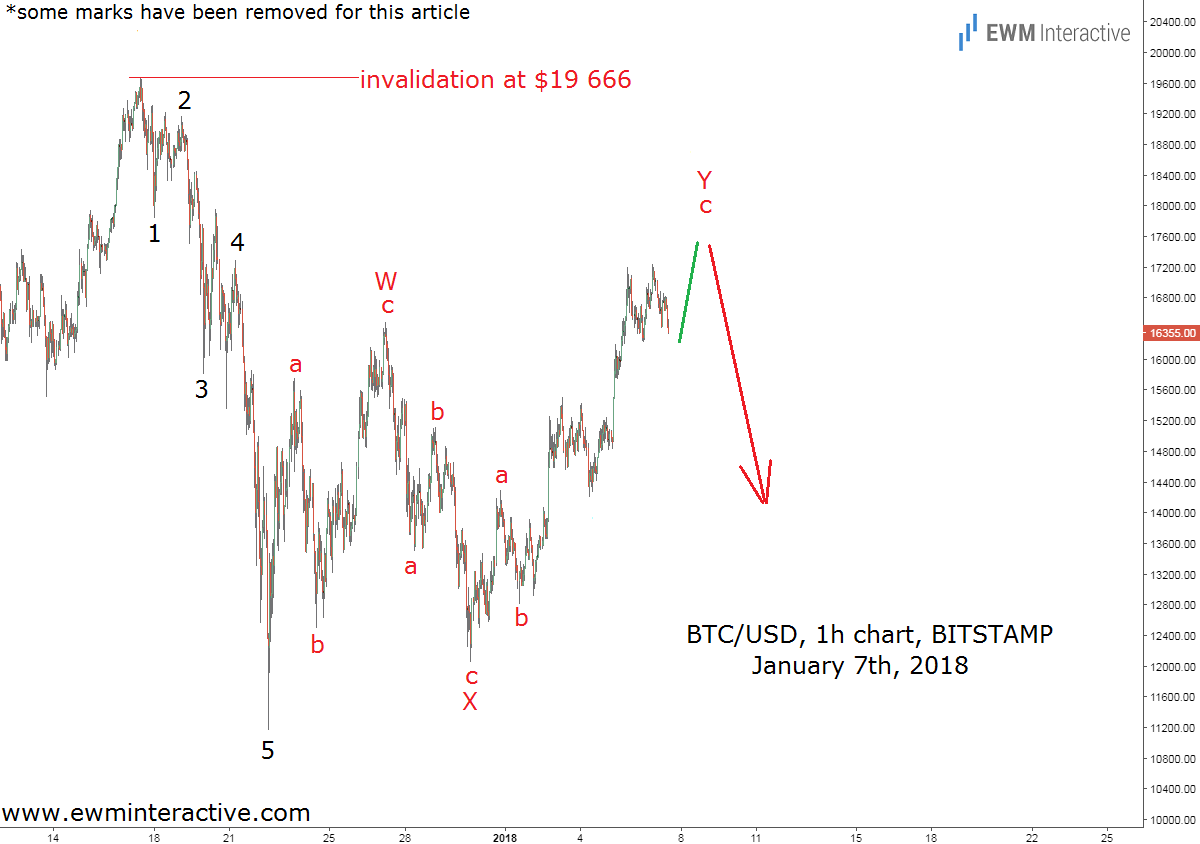
As a result, the crypto community is polarized once again. The bulls see the current selloff as a great buying opportunity, while the bears think it is the beginning of the end. Fortunately, whatever it is, the Elliott Wave Principle managed to prepare us for it. The following chart, sent to subscribers on January 7th, 2018, explains how.(some marks have been removed for this article)
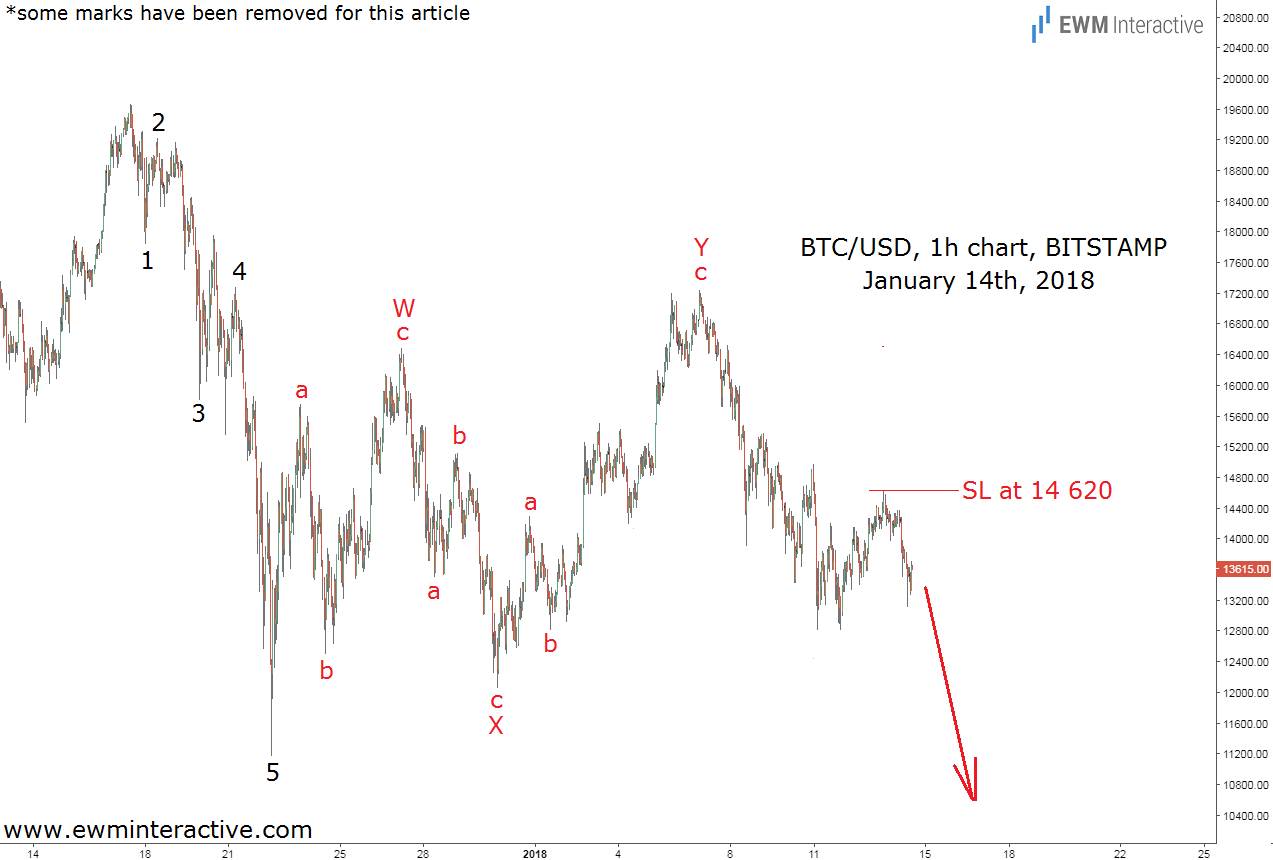
Ten days ago, while Bitcoin was trading at $16 355, we thought it was definitely not a good to time to join the bulls. In fact, joining their rivals seemed to be the less risky option, because of the 5-3 wave cycle, visible on the hourly chart of BTC/USD. A five-wave impulse from $19 666 down to $11 160, followed by a three-wave recovery up to $17 235 suggested the pair was in a downtrend and more weakness should follow. Even if a new swing high near $17 500 was reached, as long as Bitcoin traded below the invalidation level at $19 666, the odds would remain in the bears’ favor. A week later, the analysis we sent to clients on January 14th included the following chart.

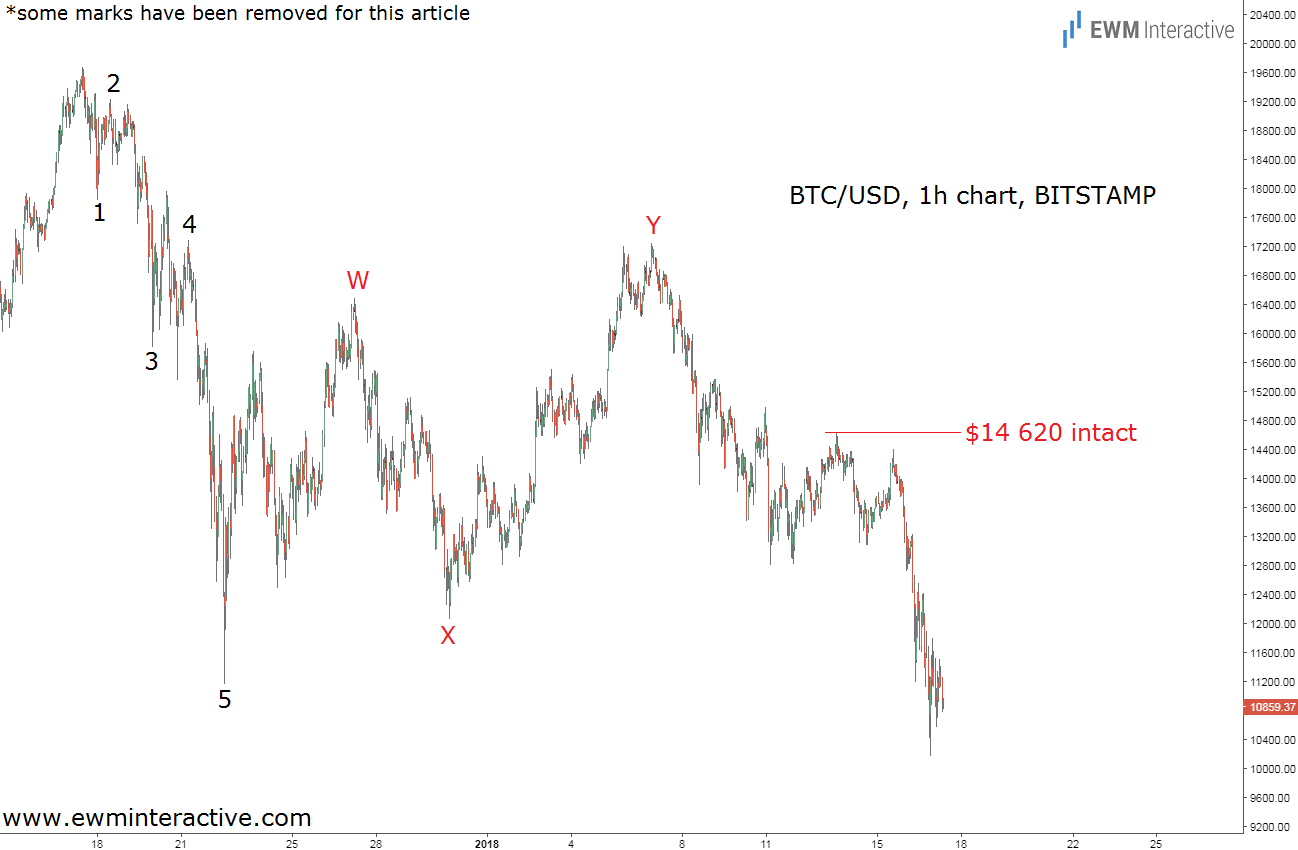
The price of Bitcoin did not even manage to reach a new swing high. Instead, it started diving right away and seven days later BTCUSD was by $2740 to $13 615. However, this chart did not suggest the bears were done, so it made sense to expect them to drag Bitcoin prices below the $11 000 mark. This allowed us to move the invalidation level from $19 666 down to $14 620. Three days later and exactly a month after Bitcoin reached its all-time high on December 17th, 2017, here is how its hourly price chart looks today.

It is true that the bulls tried to conquer $14 620. Fortunately, they failed as Bitcoin prices only rose to $14 394 on Monday. $14 620 remained intact, which meant $11 000 was still there for the bears to put their heavy paws on. As of this writing, the price of the biggest cryptocurrency is hovering around $10 350 and we are so glad the Elliott Wave principle warned us not to buy when it was $6000 higher just ten days ago.
