
Today I'm looking at Microsoft billionaire Bill Gates' latest stock buys and sells. Bill Gates founded the Bill & Melinda Gates Foundation Trust which has a current portfolio value of around USD 17.8 billion.
The trust owns only 21 stocks, of which around half of the value comes from the Berkshire Hathaway (BRK.A), Warren Buffett's insurance company.
Financial service is a big theme for Bill Gates. Other industries he prefers are defensive consumer stocks and industrials. All three sectors combined represent around 80.7 percent of Bill Gates's full asset allocation.
Bill Gates has a similar investment style to that of his friend Warren Buffett. He is a passive, long-term investor but with some different ideas and views about stocks and earnings growth. Why should it be otherwise? He’s a old tech guy.
Last Quarter, Bill Gates made only one stock purchase and sold six companies. Five of them were closed completely. The biggest impact on the portfoli was the reduction of the current Berkshire stake which impacted the portfolio by 3.59 percent.
Caterpillar (CAT) has a market capitalization of $54.33 billion. The company employs 122,402 people, generates revenue of $65.875 billion and has a net income of $5.708 billion. Caterpillar’s earnings before interest, taxes, depreciation and amortization (EBITDA) amounts to $12.167 billion. The EBITDA margin is 18.47 percent (the operating margin is 13.01 percent and the net profit margin 8.66 percent).
Financial Analysis: The total debt represents 44.92 percent of Caterpillar’s assets and the total debt in relation to the equity amounts to 228.97 percent. Due to the financial situation, a return on equity of 37.36 percent was realized by Caterpillar. Twelve trailing months earnings per share reached a value of $6.34. Last fiscal year, Caterpillar paid $2.02 in the form of dividends to shareholders. The CAT position was increased by 4.87 percent last quarter and is now down around 1 percent.
Market Valuation: Here are the price ratios of the company: The P/E ratio is 13.23, the P/S ratio is 0.82 and the P/B ratio is finally 3.13. The dividend yield amounts to 2.86 percent and the beta ratio has a value of 1.89.
Willis Group (WSH) has a market capitalization of $7.48 billion. The company employs 17,470 people, generates revenue of $3.480 billion and has a net income of $-438.00 million. Willis Group’s earnings before interest, taxes, depreciation and amortization (EBITDA) amounts to $430.00 million. The EBITDA margin is 12.36 percent (the operating margin is -6.01 percent and the net profit margin -12.59 percent).
Financial Analysis: The total debt represents 15.57 percent of Willis Group’s assets and the total debt in relation to the equity amounts to 138.49 percent. Due to the financial situation, a return on equity of -21.31 percent was realized by Willis Group. Twelve trailing months earnings per share reached a value of $-2.66. Last fiscal year, Willis Group paid $1.08 in the form of dividends to shareholders. The WSH position was sold out last quarter and had an impact to his portfolio of 0.13 percent.
Market Valuation: Here are the price ratios of the company: The P/E ratio is , the P/S ratio is 2.15 and the P/B ratio is finally 4.33. The dividend yield amounts to 2.64 percent and the beta ratio has a value of 0.87.
Autoliv (ALV) has a market capitalization of $7.94 billion. The company employs 44,151 people, generates revenue of $8.266 billion and has a net income of $485.60 million. Autoliv’s earnings before interest, taxes, depreciation and amortization (EBITDA) amounts to $1.053 billion. The EBITDA margin is 12.74 percent (the operating margin is 8.53 percent and the net profit margin 5.87 percent).
Financial Analysis: The total debt represents 9.63 percent of Autoliv’s assets and the total debt in relation to the equity amounts to 16.83 percent. Due to the financial situation, a return on equity of 13.62 percent was realized by Autoliv. Twelve trailing months earnings per share reached a value of $5.41. Last fiscal year, Autoliv paid $1.94 in the form of dividends to shareholders. The ALV position was sold out last quarter and had an impact to his portfolio of 0.05 percent.
Market Valuation: Here are the price ratios of the company: The P/E ratio is 15.36, the P/S ratio is 0.96 and the P/B ratio is finally 2.11. The dividend yield amounts to 2.41 percent and the beta ratio has a value of 1.95.
Fomento Economico (FMX) has a market capitalization of $174.12 billion. The company employs 182,260 people, generates revenue of $18.398 billion and has a net income of $1.511 billion. Fomento Economico’s earnings before interest, taxes, depreciation and amortization (EBITDA) amounts to $2.849 billion. The EBITDA margin is 15.49 percent (the operating margin is 12.35 percent and the net profit margin 8.22 percent).
Financial Analysis: The total debt represents 12.62 percent of Fomento Economico’s assets and the total debt in relation to the equity amounts to 24.05 percent. Due to the financial situation, a return on equity of 13.83 percent was realized by Fomento Economico. Twelve trailing months earnings per share reached a value of $0.40. Last fiscal year, Fomento Economico paid $0.30 in the form of dividends to shareholders. The FMX position was sold out last quarter and had an impact to his portfolio of 0.14 percent.
Market Valuation: Here are the price ratios of the company: The P/E ratio is 240.81, the P/S ratio is 1.80 and the P/B ratio is finally 14.53. The dividend yield amounts to 1.57 percent and the beta ratio has a value of 1.12.
Signet Jewelers (SIG) has a market capitalization of $5.79 billion. The company employs 17,877 people, generates revenue of $3.983 billion and has a net income of $359.90 million. Signet Jewelers’s earnings before interest, taxes, depreciation and amortization (EBITDA) amounts to $500.20 million. The EBITDA margin is 12.56 percent (the operating margin is 14.07 percent and the net profit margin 9.04 percent).
Financial Analysis: The total debt represents 0.00 percent of Signet Jewelers’s assets and the total debt in relation to the equity amounts to 0.00 percent. Due to the financial situation, a return on equity of 15.62 percent was realized by Signet Jewelers. Twelve trailing months earnings per share reached a value of $4.53. Last fiscal year, Signet Jewelers paid $0.48 in the form of dividends to shareholders. The SIG position was sold out last quarter and had an impact to his portfolio of 0.07 percent.
Market Valuation: Here are the price ratios of the company: The P/E ratio is 15.82, the P/S ratio is 1.45 and the P/B ratio is finally 2.50. The dividend yield amounts to 0.84 percent and the beta ratio has a value of 2.02.
Take a closer look at the full list of the latest stock buys and sells from Bill Gates. The average P/E ratio amounts to 16.36 and forward P/E ratio is 14.53. The dividend yield has a value of 1.46 percent. Price to book ratio is 2.40 and price to sales ratio 1.45. The operating margin amounts to 9.62 percent and the beta ratio is 1.44. Stocks from the list have an average debt to equity ratio of 0.66.
Here is the full table with some fundamentals (TTM): 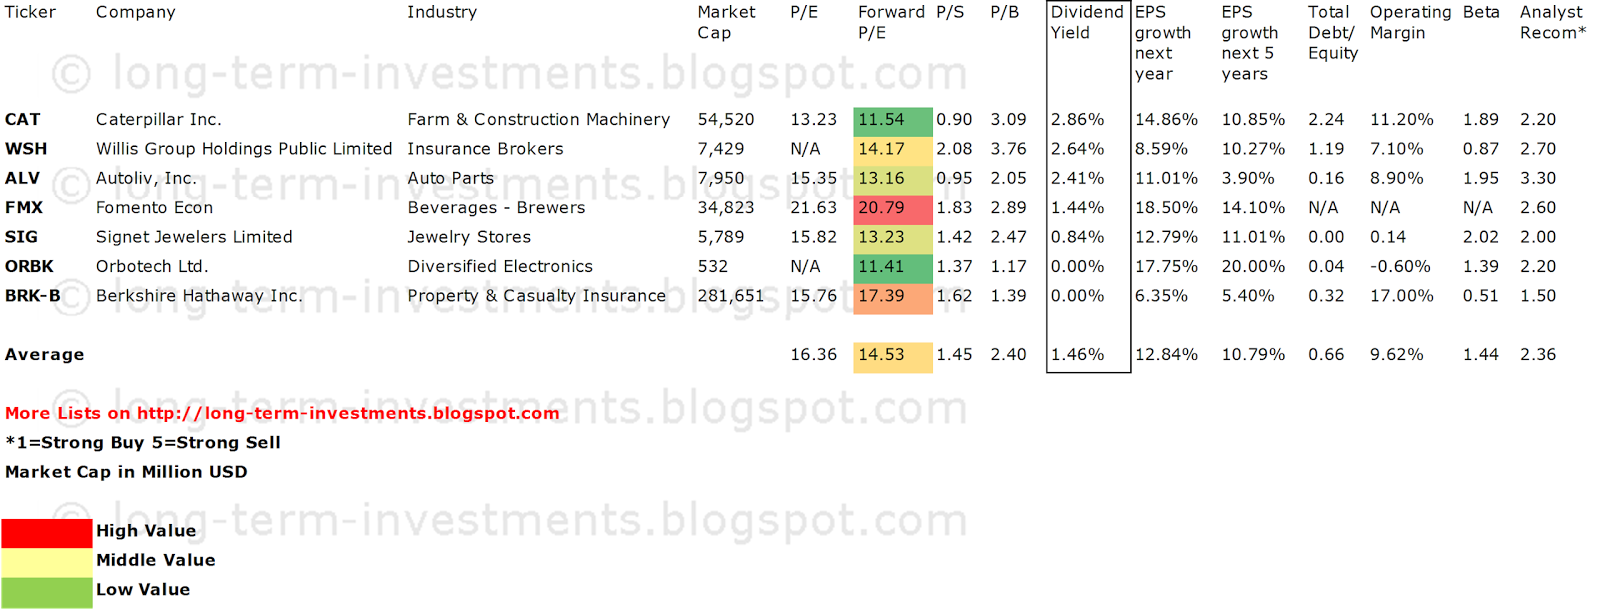
Related Stock Ticker Symbols:
CAT, WSH, ALV, FMX, SIG, ORBK, BRK-B
*I have no positions in any stocks mentioned, and no plans to initiate any positions within the next 72 hours. I receive no compensation to write about any specific stock, sector or theme.
- English (UK)
- English (India)
- English (Canada)
- English (Australia)
- English (South Africa)
- English (Philippines)
- English (Nigeria)
- Deutsch
- Español (España)
- Español (México)
- Français
- Italiano
- Nederlands
- Português (Portugal)
- Polski
- Português (Brasil)
- Русский
- Türkçe
- العربية
- Ελληνικά
- Svenska
- Suomi
- עברית
- 日本語
- 한국어
- 简体中文
- 繁體中文
- Bahasa Indonesia
- Bahasa Melayu
- ไทย
- Tiếng Việt
- हिंदी
Bill Gates' Latest Stock Buys And Sells
Published 08/26/2013, 03:26 AM
Updated 07/09/2023, 06:31 AM
Bill Gates' Latest Stock Buys And Sells
3rd party Ad. Not an offer or recommendation by Investing.com. See disclosure here or
remove ads
.
Latest comments
Install Our App
Risk Disclosure: Trading in financial instruments and/or cryptocurrencies involves high risks including the risk of losing some, or all, of your investment amount, and may not be suitable for all investors. Prices of cryptocurrencies are extremely volatile and may be affected by external factors such as financial, regulatory or political events. Trading on margin increases the financial risks.
Before deciding to trade in financial instrument or cryptocurrencies you should be fully informed of the risks and costs associated with trading the financial markets, carefully consider your investment objectives, level of experience, and risk appetite, and seek professional advice where needed.
Fusion Media would like to remind you that the data contained in this website is not necessarily real-time nor accurate. The data and prices on the website are not necessarily provided by any market or exchange, but may be provided by market makers, and so prices may not be accurate and may differ from the actual price at any given market, meaning prices are indicative and not appropriate for trading purposes. Fusion Media and any provider of the data contained in this website will not accept liability for any loss or damage as a result of your trading, or your reliance on the information contained within this website.
It is prohibited to use, store, reproduce, display, modify, transmit or distribute the data contained in this website without the explicit prior written permission of Fusion Media and/or the data provider. All intellectual property rights are reserved by the providers and/or the exchange providing the data contained in this website.
Fusion Media may be compensated by the advertisers that appear on the website, based on your interaction with the advertisements or advertisers.
© 2007-2024 - Fusion Media Limited. All Rights Reserved.