Get 40% Off
⚠ Earnings Alert! Which stocks are poised to surge?
See the stocks on our ProPicks radar. These strategies gained 19.7% year-to-date.
Unlock full list

Commodities Update: Precious And Base Metals Higher; NatGas Lower

Published 12/31/2017, 01:32 AM
Updated 07/09/2023, 06:31 AM

Some monthly charts of interest in the commodity sector, including precious metals.

The CRB Index dwells below key resistance. A break of 200 would target around 250 in 2018.
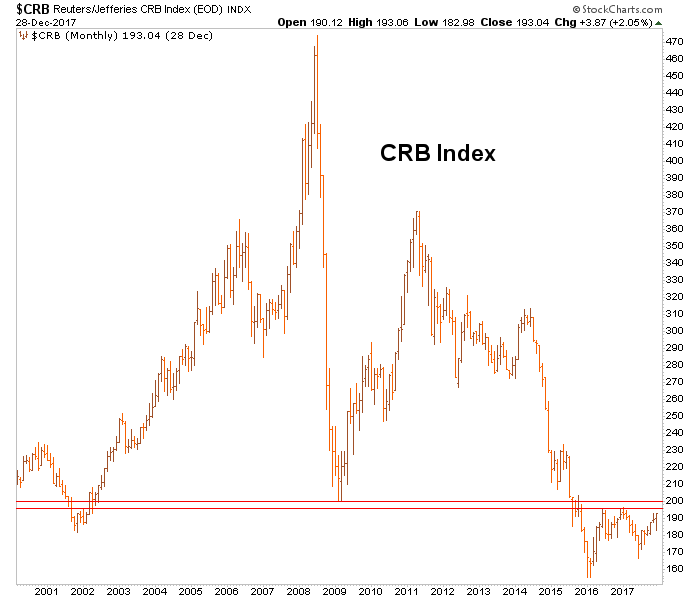
CRB Monthly Chart

CRB/SPX Ratio shows the utter devastation of the Goldilocks era of Central Bank inflation with no apparent consequences. This is not likely to last.
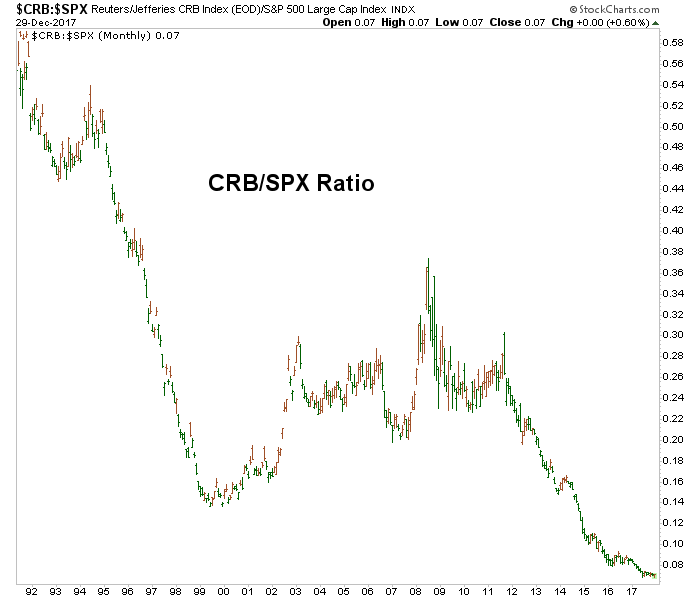
CRB/SPX Monthly Chart

WTI Crude Oil sits below resistance at 62-63, with a target of 75.
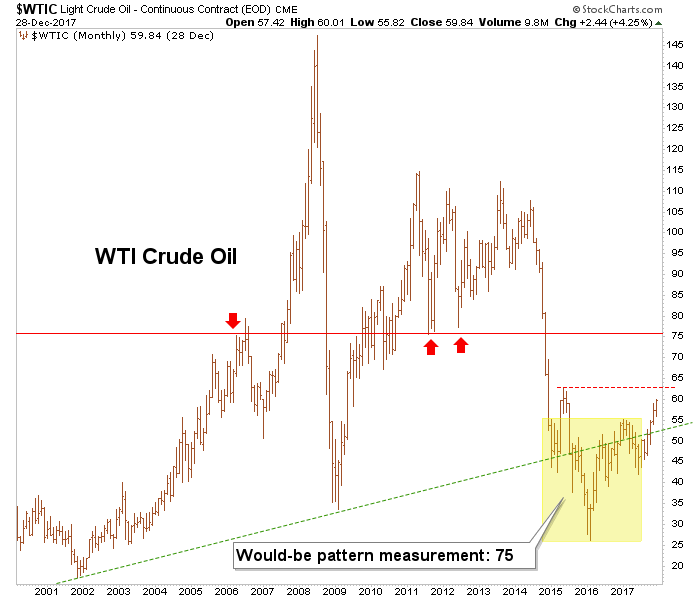
WTI Crude Oil Monthly Chart

NatGas is a basket case non-starter. The first step would be to break the red dashed line. After that, lots of overhead.
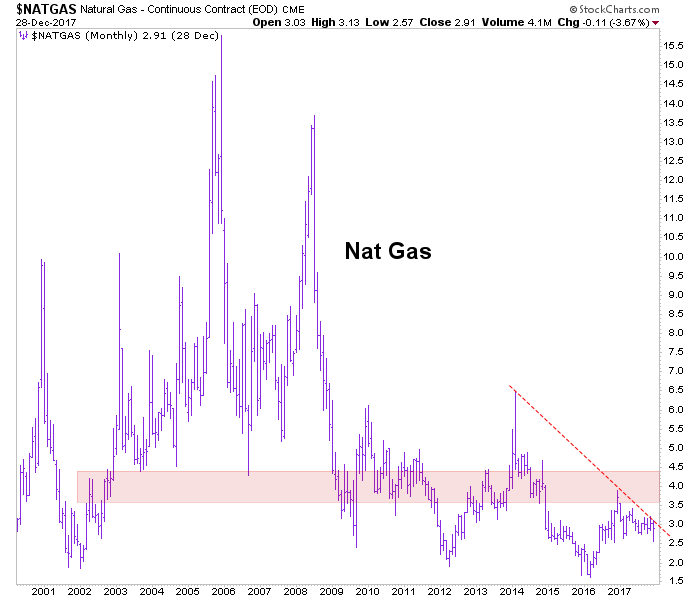
Nat Gas Monthly Chart

Industrial Metals have been a favored area for a would-be inflation phase in 2018. The chart explains why.
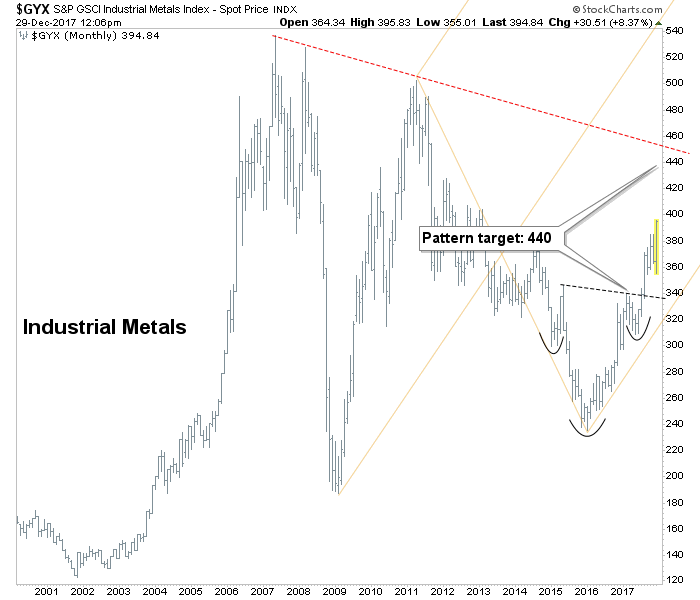
GYX Monthly Chart

Copper broke through resistance and turned it green through multiple tests of the 2.90 area. It measures to approximately 3.80/lb.
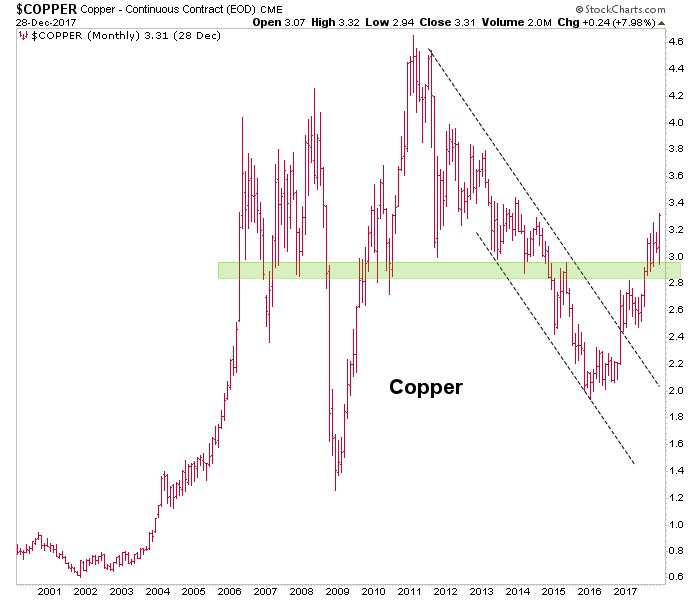
Copper Monthly Chart

GKX could bounce with the sector but there is no technical sign that it is preparing to do so. Our long-held support (buy) target is 240 +/- for Agri.
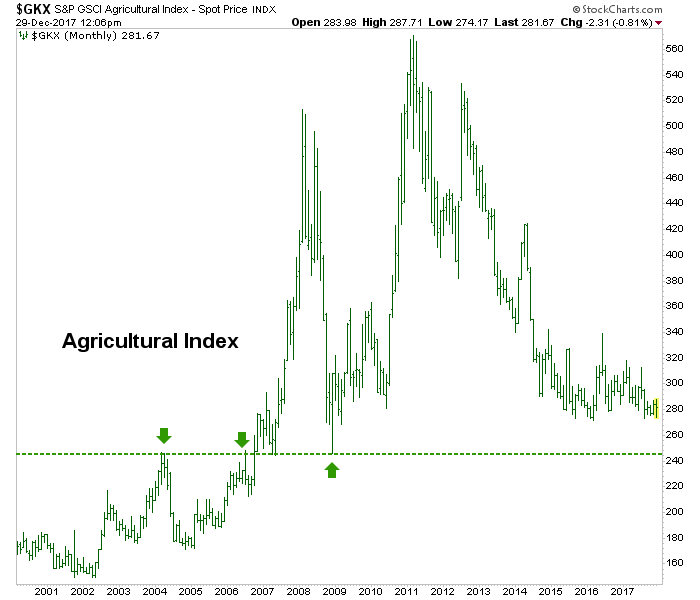
GKX Monthly Chart

Uranium Participation (TO:U), which holds u3o8, bounced on supply cut news but is at massive long-term resistance.
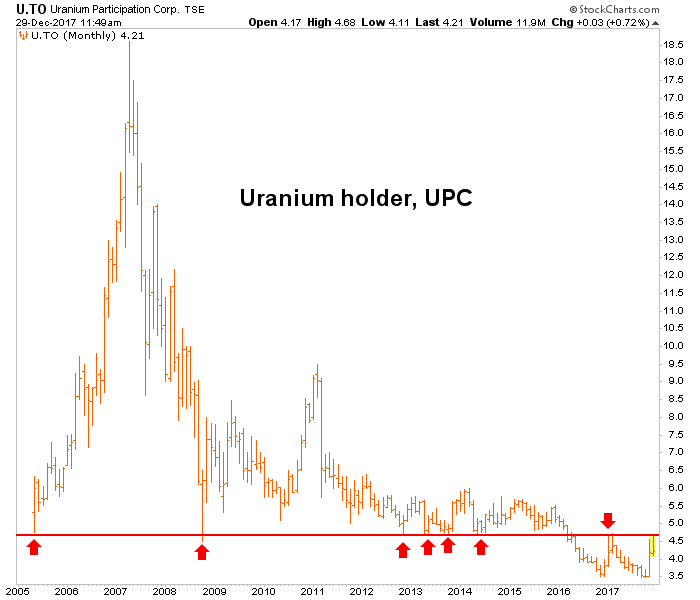
U.TO Monthly Chart

Palladium approaches all time highs. Is this a 4th Horseman? The other 3 Amigos are also riding. You may recall that in early 2013 we cross referenced a bullish Palladium/Gold ratio with bullish fundamental signs in the Semi Equipment sector to project a firming economy. Voila… and now we wait for all the happy stuff to finish up.
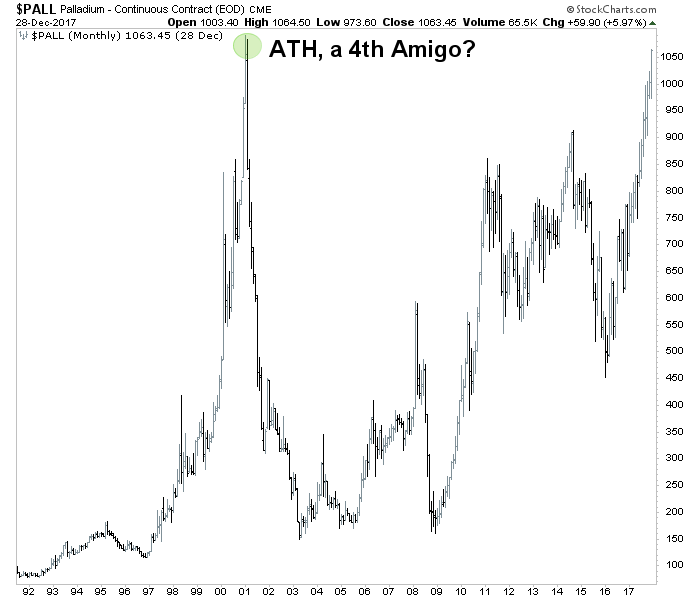
PALL Monthly Chart

Platinum has been in lock down since the last commodity cycle blew out in 2011. This precious commodity could be a good play for 2018.
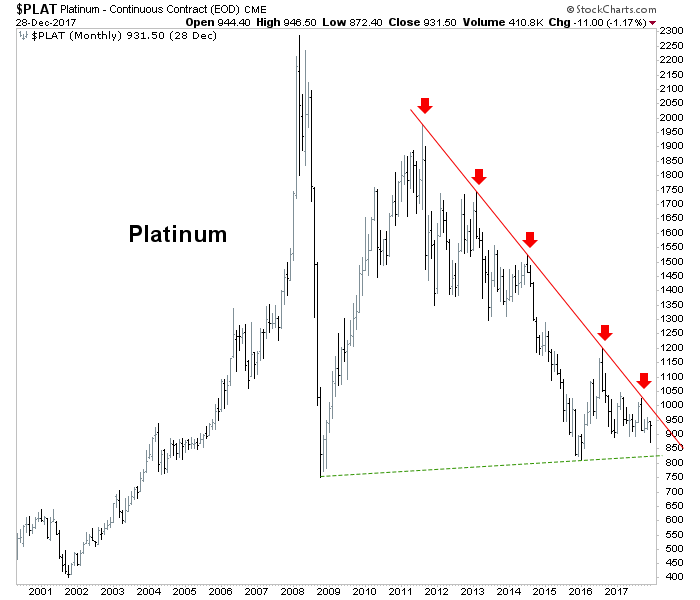
PLAT Monthly Chart

Gold stopped at the resistance that should have stopped it (that would be the gateway to a confirmed bull phase) and has inched back down the wedge. Ho hum… gold is fine.
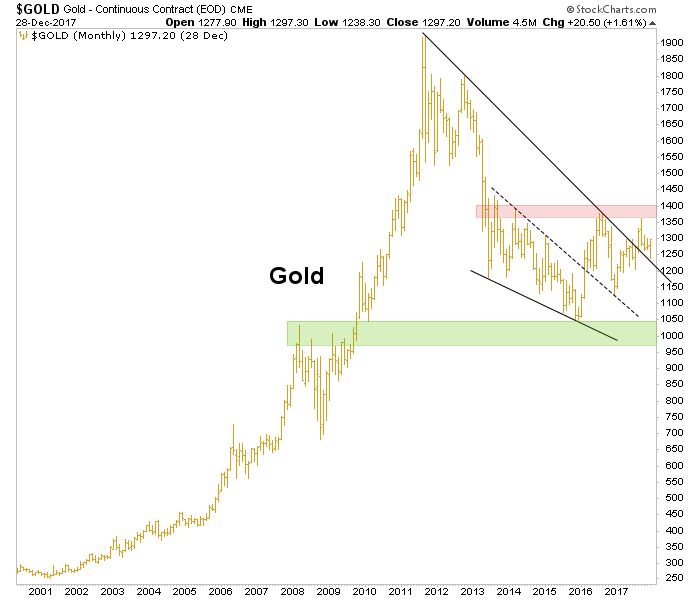
Gold Monthly Chart

Silver is fine too, in that it has not gone anywhere yet and held the trend line (which I expect to remain the case if a firm commodity view plays out in first half 2018).
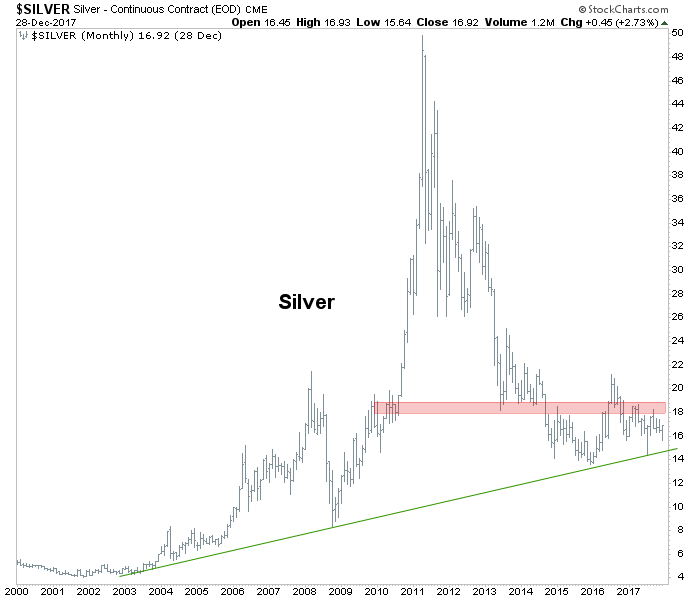
Silver Monthly Chart

Gold Miners are and have been in a process. Remember gold bugs, the sector does not distinguish itself as unique until the commodity items above eventually flame out along with the broad markets. So for now, it’s ‘inflation trade’ and this sector is not special. The ongoing consolidation in HUI is interesting though, and this will be the sector in waiting when things fall apart.

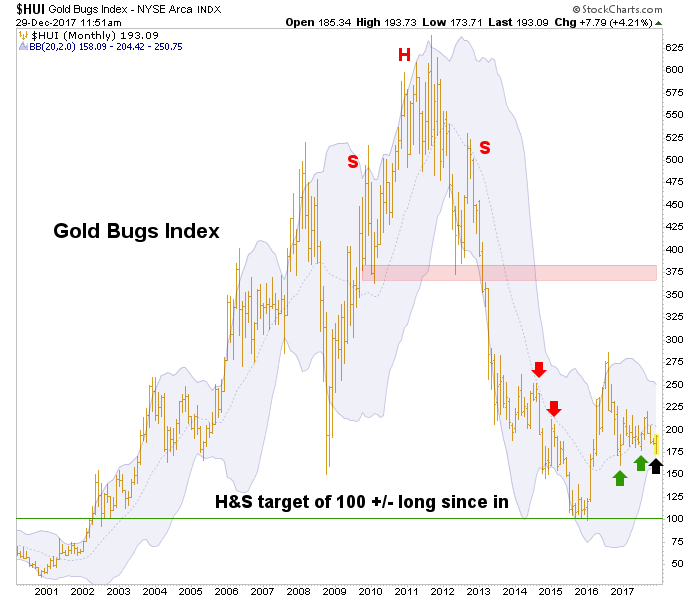
HUI Monthly Chart

Latest comments

Which is a good platform to trade such markets as Palladium? I am using eToro and i don't think Palladium is an option.
Dear Mr. Gary Best Wishes for the year 2018. Have a Nice time. Thanks for your precious analysis on precious metals. Good Luck!
Sad analysis, no fundementals discussed
Risk Disclosure: Trading in financial instruments and/or cryptocurrencies involves high risks including the risk of losing some, or all, of your investment amount, and may not be suitable for all investors. Prices of cryptocurrencies are extremely volatile and may be affected by external factors such as financial, regulatory or political events. Trading on margin increases the financial risks.
Before deciding to trade in financial instrument or cryptocurrencies you should be fully informed of the risks and costs associated with trading the financial markets, carefully consider your investment objectives, level of experience, and risk appetite, and seek professional advice where needed.
Fusion Media would like to remind you that the data contained in this website is not necessarily real-time nor accurate. The data and prices on the website are not necessarily provided by any market or exchange, but may be provided by market makers, and so prices may not be accurate and may differ from the actual price at any given market, meaning prices are indicative and not appropriate for trading purposes. Fusion Media and any provider of the data contained in this website will not accept liability for any loss or damage as a result of your trading, or your reliance on the information contained within this website.
It is prohibited to use, store, reproduce, display, modify, transmit or distribute the data contained in this website without the explicit prior written permission of Fusion Media and/or the data provider. All intellectual property rights are reserved by the providers and/or the exchange providing the data contained in this website.
Fusion Media may be compensated by the advertisers that appear on the website, based on your interaction with the advertisements or advertisers.
© 2007-2024 - Fusion Media Limited. All Rights Reserved.