Get 40% Off
🚨 Volatile Markets? Find Hidden Gems for Serious OutperformanceFind Stocks Now

Beware Possible Strong Move To The Downside For Gold

Published 11/10/2019, 12:18 AM

A line chart can give you a different perspective vs a bar chart which is why I like to use them both to help uncover a potential pattern. Line charts can oftentimes give you a quicker heads-up when a stock is breaking out.

Below is a weekly line chart for the SPDR® Gold Shares ETF (NYSE:GLD) which shows why I’m so concerned about gold and the PM complex right now. This weekly line chart shows a triple top with the breakout in progress. My biggest concern is that we could see some reverse symmetry to the downside as shown by the blue arrows. Many times, how a stock goes up is how it may come down over that same area—especially when the move was strong.

Note the tops at the 2016 high at reversal point #1 and the 2018 top at reversal point #3 in the 2016 triangle. After the initial breakout from the top in 2016 the price action backtested the top trendline, which produced the right shoulder of a bigger H&S top and then came the strong impulse move down. Some of you may remember the 2018 top when GLD was trying to break out to a new high but couldn't muster up enough energy to do so. I said then, if the bulls were in charge that it was time for them to step up to the plate; but after four hits of the top rail the bears finally won the battle with another strong impulse move to the downside.

3rd party Ad. Not an offer or recommendation by Investing.com. See disclosure here or remove ads .

At a bare minimum we currently have a reversal pattern in place, triple top, that is reversing the last impulse move up. There is not a lot of support to slow down a move lower which is why we could possibly see a strong move to the downside, reverse symmetry.
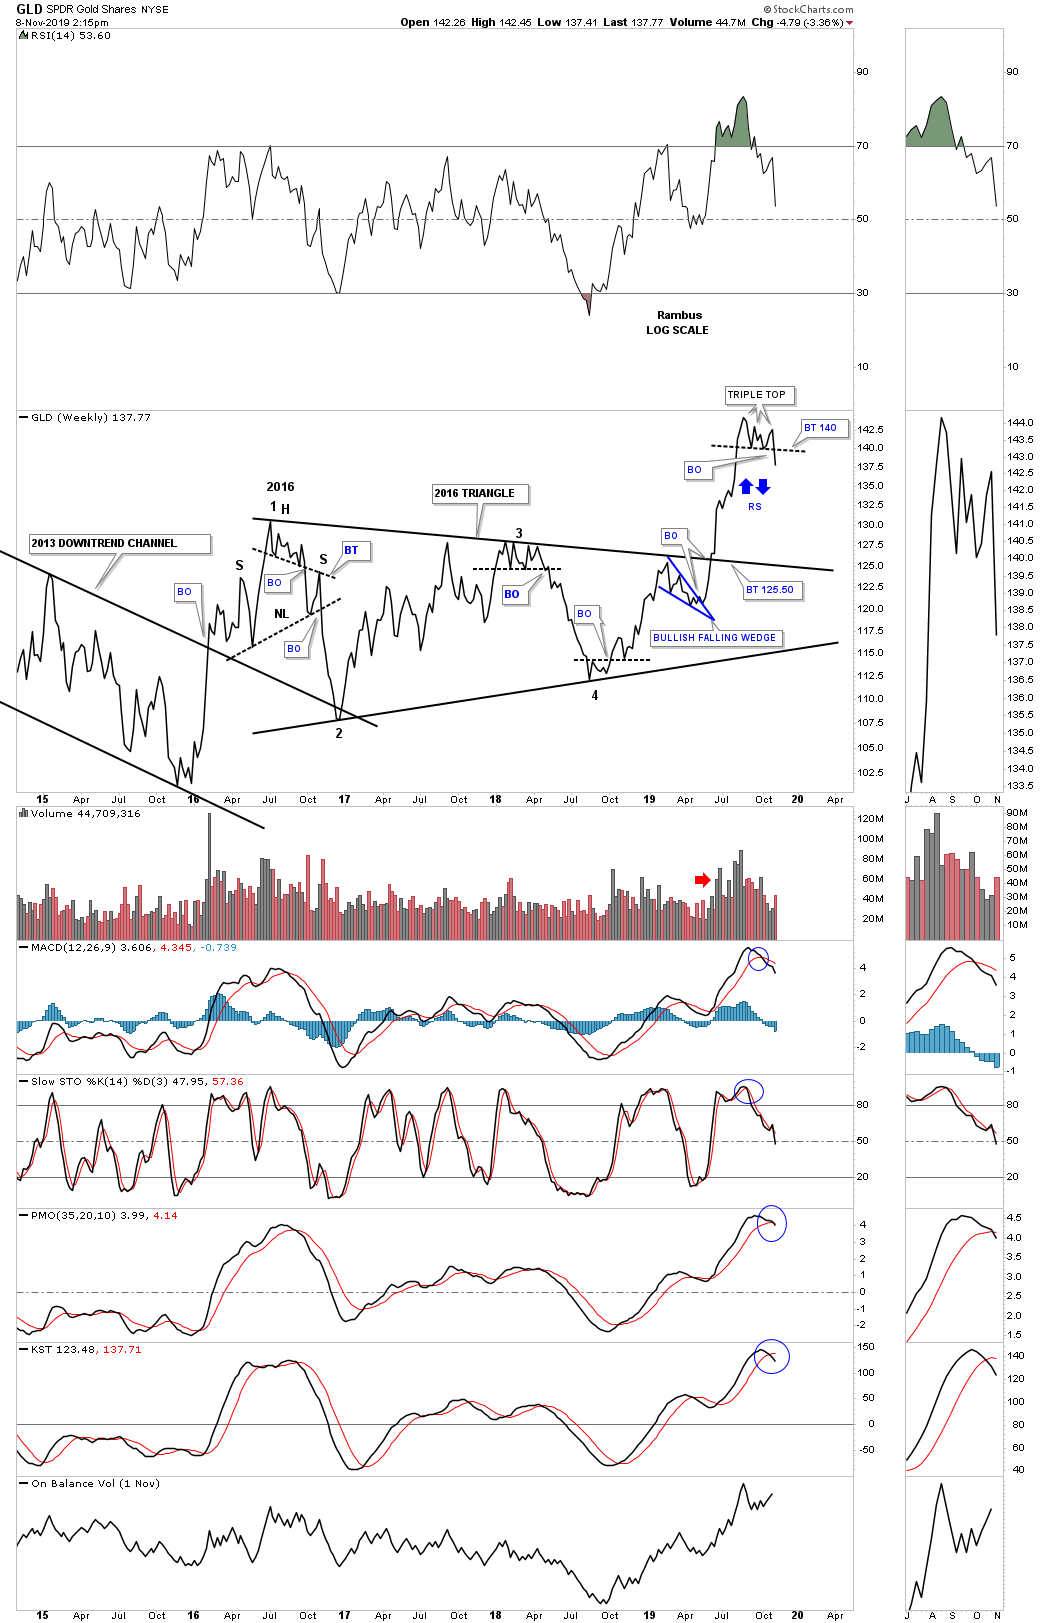
GLD Weekly Chart

Latest comments

"SPDR® Gold Shares ETF". . David Tablish, you seem very familiar with this particular gold fund. I've spent quite a bit of time doing my due diligence into GLD. Would you happen to know why there is a clause in the GLD prospectus that states GLD has no right to audit subcustodial gold holdings? The GLD managing organizations sure went out of their way to create this glaring audit loophole. What is the purpose of this loophole? Additionally, the GLD organizations promise that this fund is 100% backed by actual physical gold but yet they staunchly deny retail investors the right to any of their listed physical gold.. . I remember there was a highly publicized visit by CNBC's Bob Pisani to GLD's gold vault. This visit was organized by GLD's management to prove the existence of GLD's gold but the gold bar held up by Mr. Pisani had the serial number ZJ6752 which did not appear on the most recent bar list at that time. It was later discovered that this "GLD" bar was actually owned by ETF Securities.
Note that even on the subject of GLD's insurance, they are not at all straightforward about it. Their representatives will not confirm nor deny the existence of GLD's insurance. I recommend anyone curious about this to confirm via calling GLD's publicly listed number for general inquiries at 866 320 4053 and ask about this clause from the GLD prospectus: "The Custodian maintains insurance with regard to its business on such terms and conditions as it considers appropriate which does not cover the full amount of gold held in custody." Exactly how much of the fund is insured? They will not give you a straight answer and might even throw in some bizarre excuse which I've experienced. Why hide this information from investors? The people behind GLD certainly do not seem like the most honest types.
on balance vol shows nothing but accumulation.
gold may reach 3000 soon
Magic 8 Ball says "Not Likely"
If another gfc happens then it is possible
fundamentally it is a great time to load up on gold and silver imo, technicals are just a bunch of guessing based on indicators that typically only have 50% success rates anyway. you can cherry pick whatever indicators you want to support an argument, the bots that control the market just do a bunch of math and move the price in whatever direction makes them money.
Yup; it's been demonstrated through mathematics time and time again that over the long-term the markets are a random stochastic process. You can imagine all the lines and patterns you want, but you're being fooled by randomness (To quote Taleb) That's not saying price won't trend for a period of time or that you can't get lucky and time it right. But over the long haul, you've got a 50/50 chance of being right. If you don't believe it, go use software to generate random candle data and lo and behold, you will see all kinds of patterns and trends. In random data. That ought to tell anyone that technical analysis is largely worthless.,
how are fundamentals not guessing?  Which fundamentals do you follow?  How do you quantify them?  How do you know how the market will interpret these fundamentals?  There are an infinite number of variables one could use to make a decision, you have to limit them at some point.
if you do not know the difference between fundamentals and technicals, i encourage you to pick up some basic economic readings. please let me know if you would like some references to get you started.
You can always find a chart that fits your agenda. What we do know, is that the big investment banks will keep on buying the dollar, driving it up, untill Aramco's IPO.
my analysis according to the illustrated chart is that good will fall to(RS) 132, then go up to back test BT 140 and then fall like rain until it reach BT 125.50.
so do you think that gold will keep falling this new week?
No. It will not. If this conclusion is based on a line chart it’s just a bs. Line chart does not give you all the information you need to make technical analysis. Further more the uncertainty is so big that seeing the gold falling that much is improbable.
 There is a large probability that gold will see rapid harsh selloffs over the next month.
Risk Disclosure: Trading in financial instruments and/or cryptocurrencies involves high risks including the risk of losing some, or all, of your investment amount, and may not be suitable for all investors. Prices of cryptocurrencies are extremely volatile and may be affected by external factors such as financial, regulatory or political events. Trading on margin increases the financial risks.
Before deciding to trade in financial instrument or cryptocurrencies you should be fully informed of the risks and costs associated with trading the financial markets, carefully consider your investment objectives, level of experience, and risk appetite, and seek professional advice where needed.
Fusion Media would like to remind you that the data contained in this website is not necessarily real-time nor accurate. The data and prices on the website are not necessarily provided by any market or exchange, but may be provided by market makers, and so prices may not be accurate and may differ from the actual price at any given market, meaning prices are indicative and not appropriate for trading purposes. Fusion Media and any provider of the data contained in this website will not accept liability for any loss or damage as a result of your trading, or your reliance on the information contained within this website.
It is prohibited to use, store, reproduce, display, modify, transmit or distribute the data contained in this website without the explicit prior written permission of Fusion Media and/or the data provider. All intellectual property rights are reserved by the providers and/or the exchange providing the data contained in this website.
Fusion Media may be compensated by the advertisers that appear on the website, based on your interaction with the advertisements or advertisers.
© 2007-2024 - Fusion Media Limited. All Rights Reserved.