Covered call writers and put-sellers must set goals regarding targeted premium returns before entering trades. These objectives are based on personal risk tolerance, market assessment and chart technicals. One of the most flagrant mistakes made by option sellers is to make trade decisions based on the highest premium returns. Covered call writing and put-selling are conservative option strategies geared to conservative investors who have capital preservation as a key strategy goal. This article will highlight a trade initiated by a member of an investment club who asked me to analyze the trade.
Proposed trade with Portola Pharmaceuticals Inc (NASDAQ:PTLA)
- Buy PTLA at $39.00
- Sell $35.00 1-month call at $9.10
Analysis
An in-the-money strike was selected indicating a defensive posture in the trade where the intrinsic value component will protect the time value component. This will generate additional downside protection but not allow for additional share appreciation potential profit.
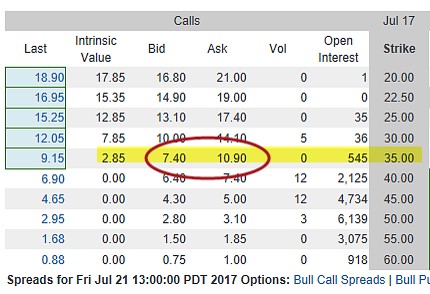
Options chain for PTLA on 6/23/2017

Analysis
The $35.00 strike has adequate open interest (545 contracts) and a spread of $7.40 – 10.90. A “negotiated price” of $9.10 was accepted.
Calculations with the Ellman Calculator multiple tab

Analysis
An initial time value return of 14.6% with a downside protection (of that initial profit) of 10.3% is huge and seems too good to be true on the surface. In fact, it is too good to be true. Whenever there is enormous premium returns we know that it is because the underlying security is extremely volatile. High implied volatility translates into high risk as share value can decline below the breakeven, $29.90 in this scenario.
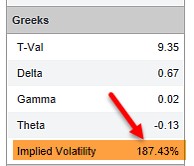
Option Greeks and implied volatility

Analysis
The implied volatility calculated for this $35.00 in-the-money call option is a staggering 187.43%, more than 20 times that of the S&P 500 on 6/23/2017. This is the reason for the great returns but hidden in the weeds lies the immense risk preparing to rear its ugly head.
Discussion
The amount of profit we stand to generate from investment vehicles is directly related to the degree of risk we are willing to assume. We should never be enticed by high premium returns until we have analyzed the amount of risk we are about to incur and make an assessment if it meets our personal risk tolerance profile.
Market tone
Global dipped slightly lower this week along with an increase in volatility. The price of a barrel of West Texas Intermediate crude oil fell about $1 to $56.10. Volatility, as measured by the Chicago Board Options Exchange Volatility Index (VIX), rose to 11.43 from 11.10 a week ago. This week’s economic and international news of importance:
- The US House of Representatives passed its version of the Republican tax bill by a vote of 227–205
- The Senate Finance Committee passed its version of the bill late Thursday, with the full Senate expected to vote after Thanksgiving
- Japan reported its seventh consecutive quarter of growth in the third quarter, the longest streak in more than 15 years
- Europe is experiencing the fastest growth rate in a decade, rising 2.5% year over year, which is a faster pace than the 2.3% US rate
- The United States, however, experienced stronger growth in Q3 than the Eurozone
- Venezuela and state-owned oil company Petróleos de Venezuela (PDVSA) were declared to be in selective default by the three major credit rating agencies
- UK prime minister Theresa May’s continued leadership of the Conservative Party was called into question last weekend as the Sunday Times reported that 40 members of her party have agreed to sign a letter of no confidence
- According to FactSet Research, companies who make more than 50% of their sales outside the US showed much faster earnings growth in the third quarter than companies whose overseas sales come in at less than 50%
- For the S&P 500 Index as a whole, earnings growth is running around 6.1
- Those with greater sales outside the US saw Q3 revenues jump 10% year over year, while those with mostly US sales rose 4.2%
THE WEEK AHEAD
Mon Nov 20th
- None
Tue Nov 21th
Wed Nov 22nd
- US: Durable goods, Fed minutes
Thu Nov 23rd
- UK: Q3 GDP
- Eurozone: Flash purchasing managers’ indices
- US: Markets closed for Thanksgiving
- Canada: Retail sales
Fri Nov 24th
- US: Flash PMIs
For the week, the S&P 500 dipped by 0.13% for a year-to-date return of 15.19%
Summary
IBD: Market in confirmed uptrend
GMI: 6/6- Buy signal since market close of August 31, 2017
BCI: My portfolio makeup reflects a neutral bias, selling an equal number of out-of-the-money and in-the-money calls. Waiting to see how the vote on the new tax plan plays out before taking a more bullish stance. Outside of this concern the global economy is performing well.
WHAT THE BROAD MARKET INDICATORS (S&P 500 AND VIX) ARE TELLING US
The 6-month charts point to a neutral outlook. In the past six months, the S&P 500 was up 9% while the VIX (11.43) moved up by 9%.
Much success to all,
