Market sentiment, and therefore market prices, continually swing like a pendulum as investors attempt to locate an equilibrium price. Not surprisingly, that pendulum almost always overshoots the fair price of any market. In December of 2018 we witnessed the US stock indices plummet beyond logical reasoning and with prices currently swinging in the other direction, we expect to see unsustainably exuberant levels for the S&P 500 in the coming weeks before optimism, and prices, peak.
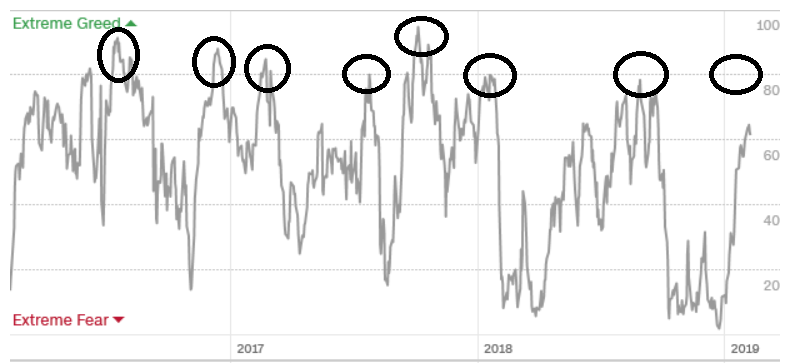
Despite a roughly 400-point rally in the S&P 500 from the December 26th lows, sentiment readings are not yet saturated. For instance, the CNN Fear & Greed index which uses factors such as the put/call ratio, market breadth, and junk bond demand is at a level of 61 out of 100. This depicts a market with a moderate amount of greed built into it, but we are a far cry from an extreme greed reading of 90 which occurred in 2018 prior to late-year volatility. In fact, it is rare for the index (and the underlying equity market) to turn before reaching 90 (extreme greed).
Additionally, our friends and the Consensus Bullish index claim only 50% of professional traders and investors polled are currently bullish the market. While such a neutral reading isnt necessarily bullish, it certainly isnt suggesting sentiment is frothy. In our eyes, this is a clue that market participants still have some ammo left to fire at this rally in the short-run.
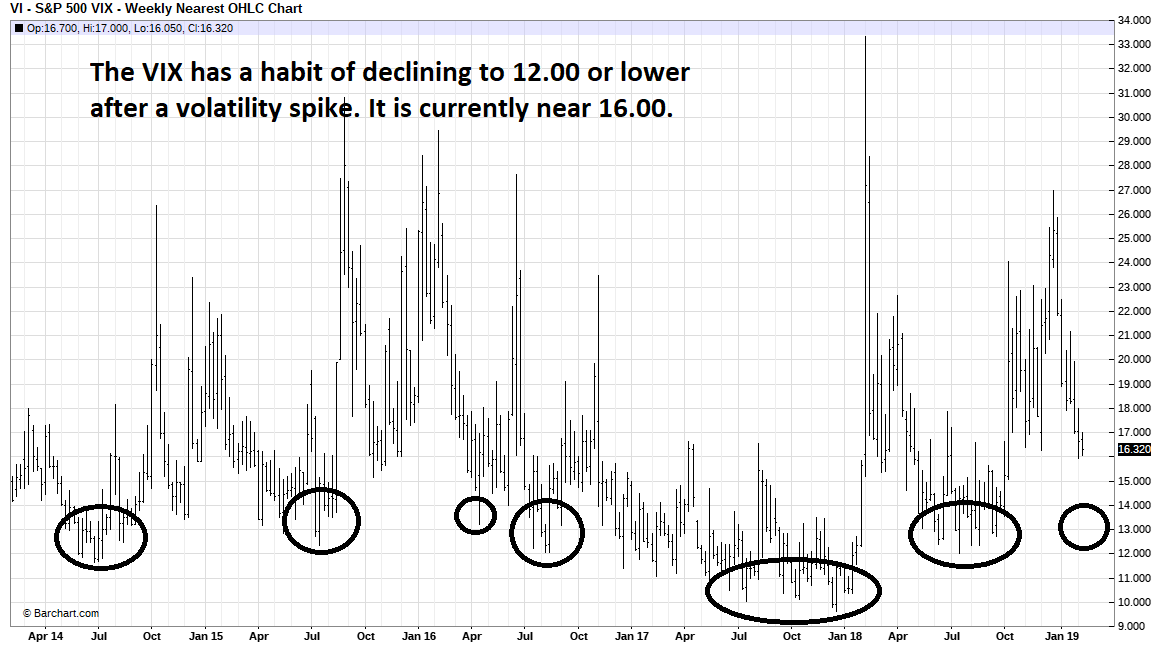
Similarly, the VIX, a volatility index based on the implied volatility built into the S&P 500 options market, is currently hovering near 16.00. Historically, volatility spikes in the VIX have been followed by retreats into the 12.00 to 10.00 area. Thus, the odds suggest the S&P grinds higher while the VIX works its way lower; at least for the time being. It would be rare to see a reversal in the VIX and, therefore, S&P from current levels.
We are amid the best six months
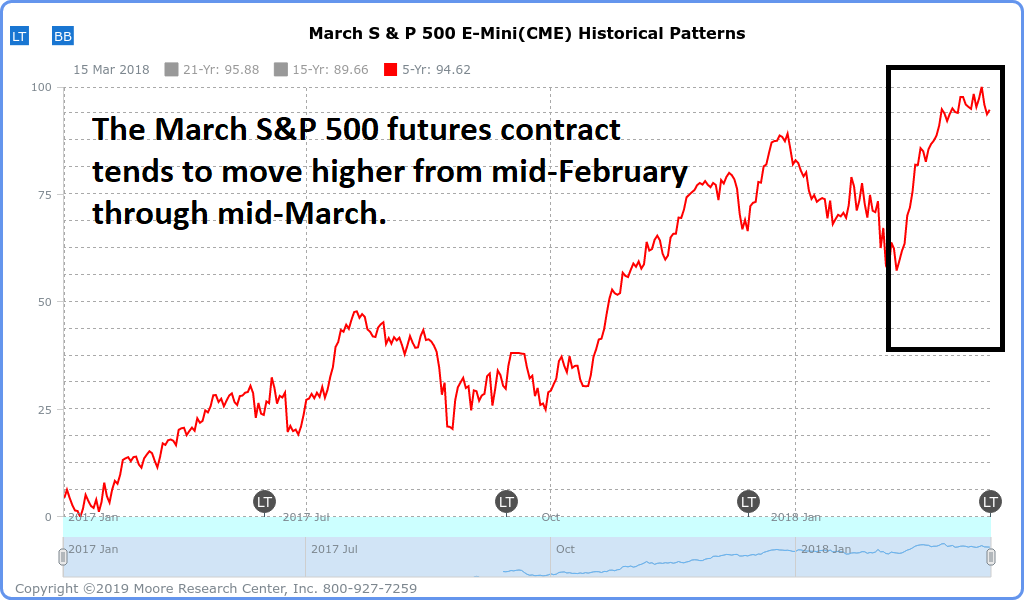
According to the Stock Traders Almanac, the best six months for the stock market ranges from November 1st through April 30th. February is generally the weak link in this stretch, but gains and losses are, on average, minimal. The seasonal pattern created by MRCI (Moore Research Center Incorporated) of the E-mini S&P 500 futures contract suggests the market tends to find a low in the second week of February and rally through contract expiration in mid-March. Of course, the E-mini futures and the cash S&P 500 index are nearly perfectly correlated. We prefer to chart the S&P futures due to the fact that they trade nearly around the clock and encompass news and events that occur during overseas trading hours.
S&P 500 weekly chart
Whether the topic is art, real estate, or stocks, prices are always relative. In early 2018 the 2700 level in the S&P 500 felt expensive, but soon after most looked at that price as cheap. By the fall of 2018, the same roller coaster of emotions occurred leaving most believing 2700 was cheap only to eventually conclude in early 2019 that it might be expensive.
We believe 2700 is probably a fair price for the S&P. After all, it has crossed this area on multiple occasions and has always found its way back. But as noted prior, markets often overshoot their equilibrium price. During the December route in the S&P, we suggested that 2800, and maybe even 3000, could be seen by early 2019. We still believe that is the case. Albeit, 3000 would likely only be seen if the Chinese US trade tariff scuffle comes to an end and there are no more imminent government shutdown threats. Nevertheless, 2800 is reasonably attainable even without fundamental help (but it wouldnt hurt).
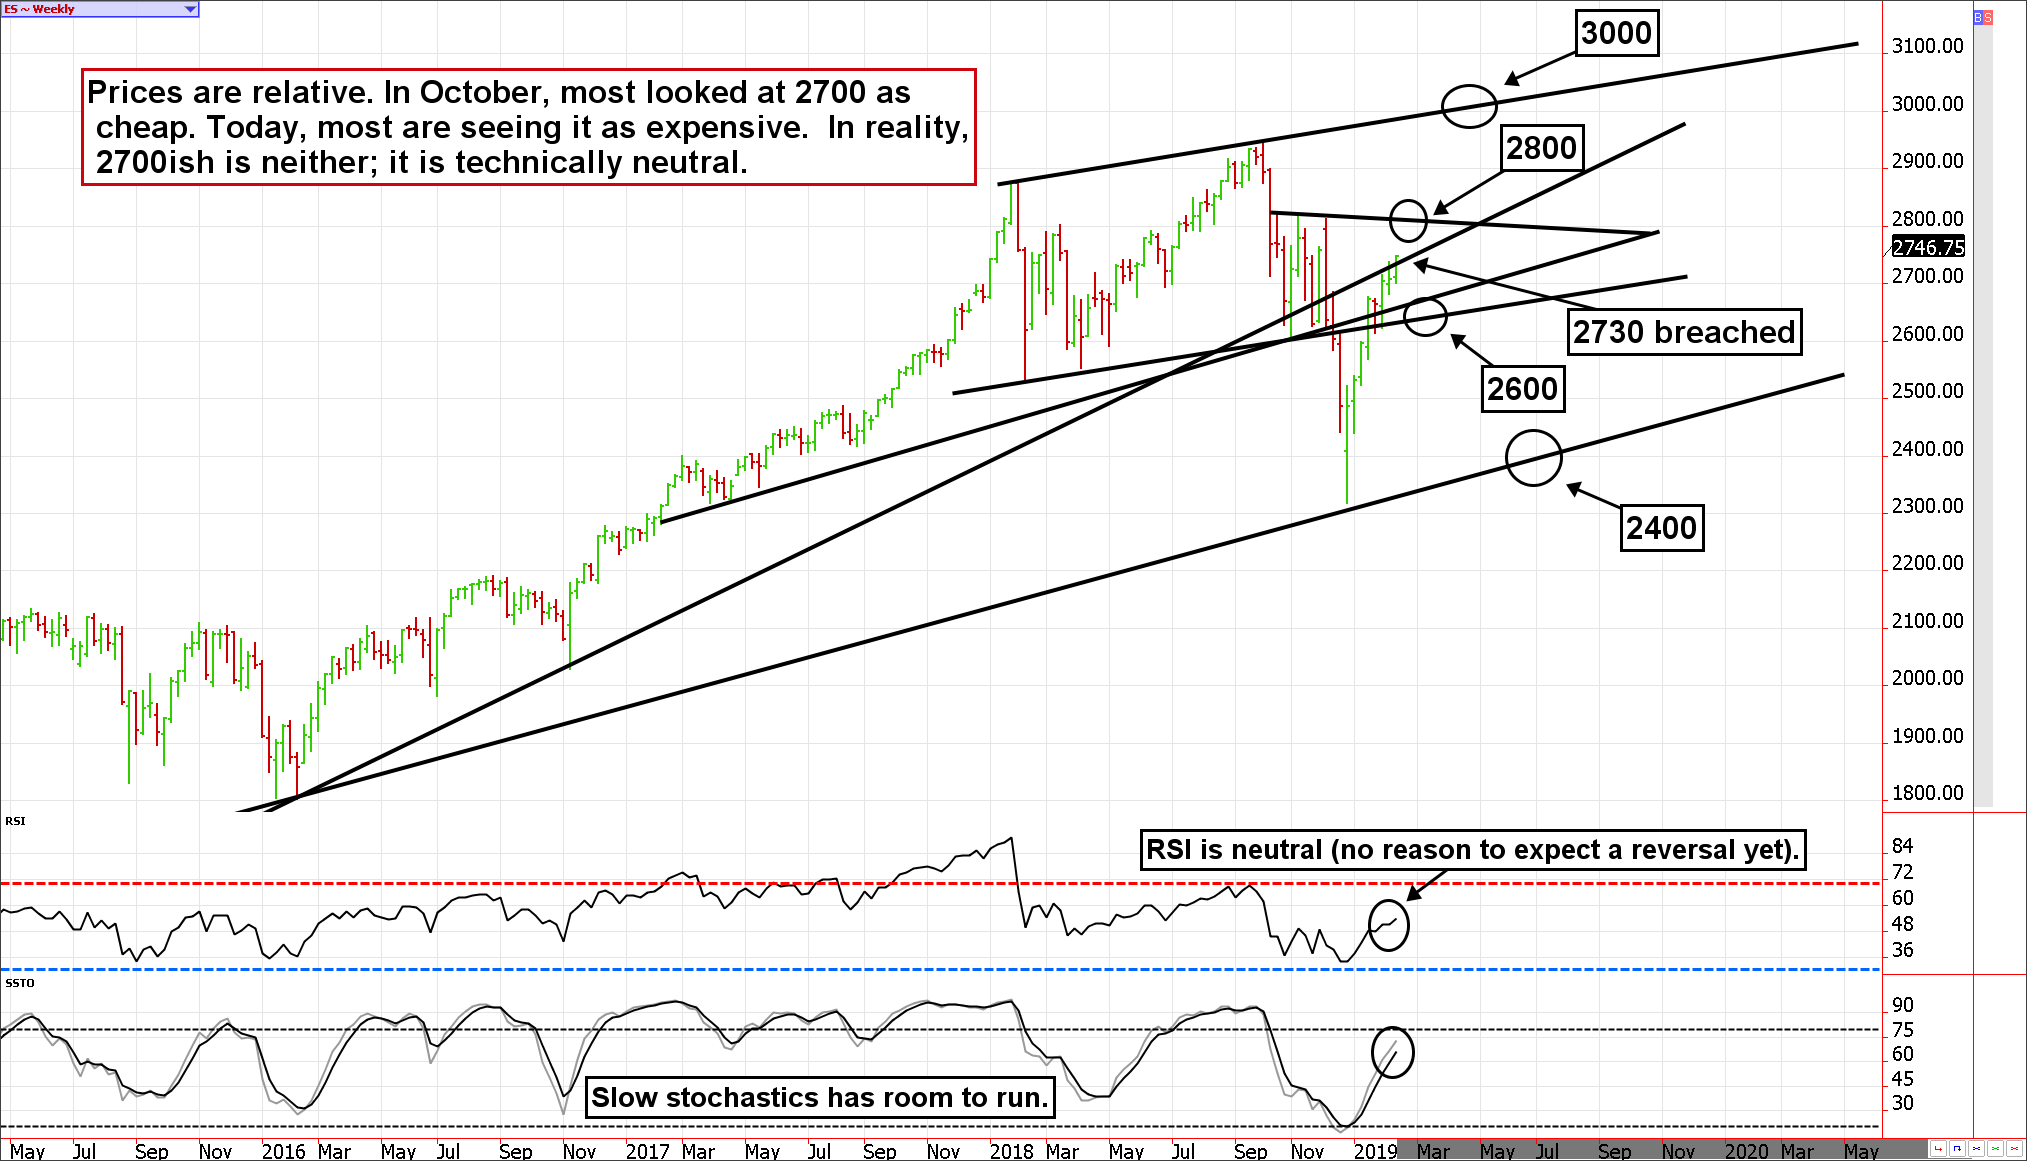
On a weekly chart of the S&P 500 futures we can see the market has broken resistance near 2730 with technical oscillators such as the RSI (Relative Strength Index) and Slow Stochastics at mid-level valuations and pointing higher overall. we dont see any reason to expect the equity uptrend to reverse immediately. Even at 2800, we doubt technical oscillators and investor optimism will be at extreme overbought levels, but we acknowledge the necessity for continued good news on the trade front to even entertain the idea of gains beyond 2800 resistance. If we are wrong about a continued grind higher in the S&P, a reversal would run into support near 2600, but a breach at that price could send prices cascading toward 2400. This isnt necessarily expected but if seen, 2400 would be an attractive area to be a bull.
S&P 500 Monthly Chart
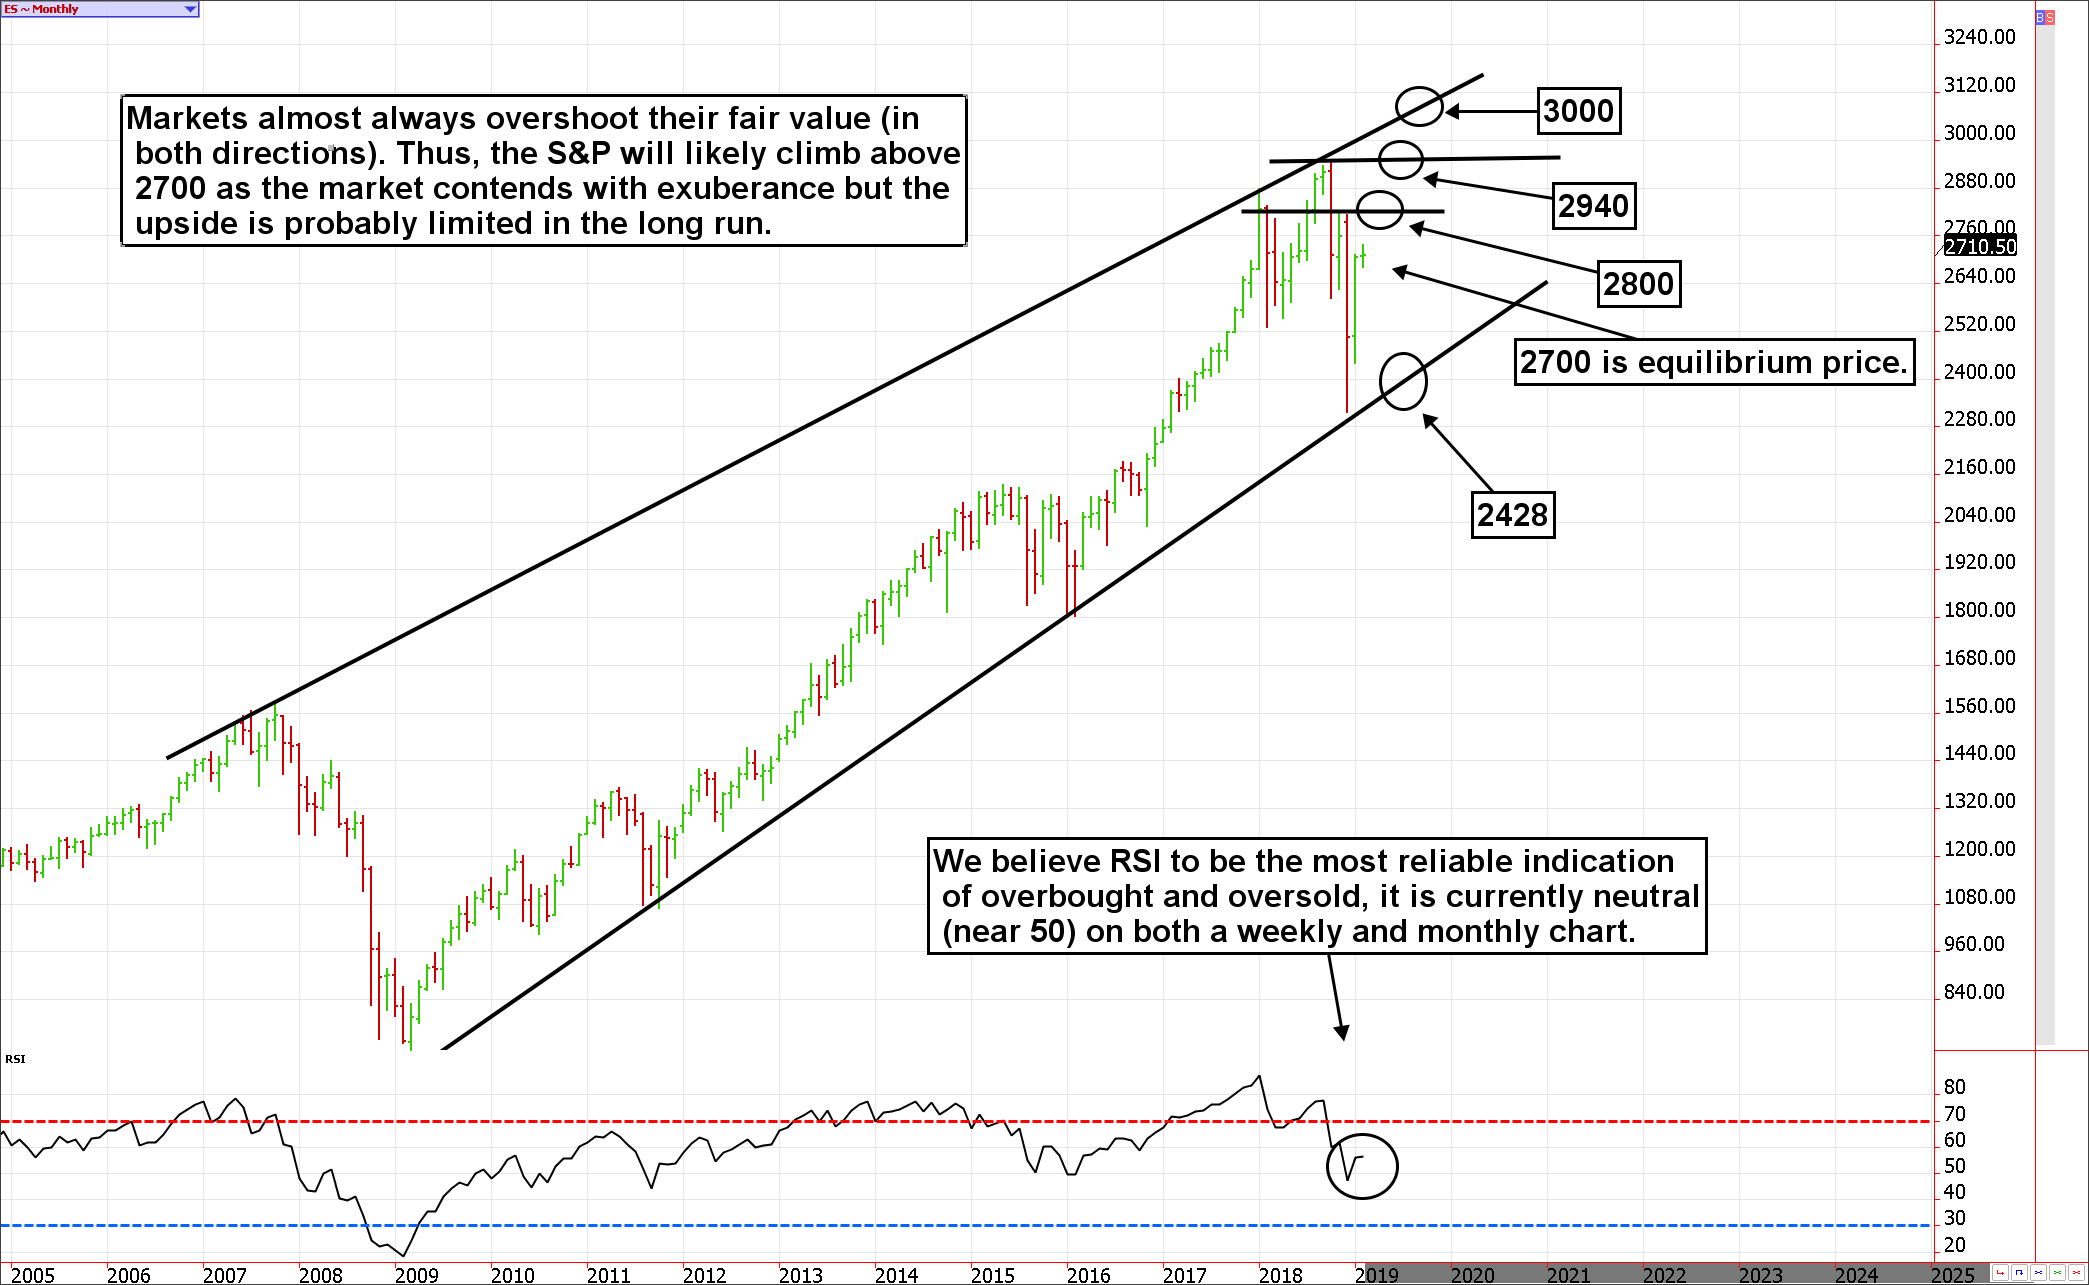
We like to confirm our weekly chart analysis on the monthly chart. On occasion, the two different time frames can paint a wildly different picture. In this case, our overall conclusion is the same. The technical indicator we believe to be most accurate in identifying overbought and oversold markets, the RSI (Relative Strength Index) is mid-range and pointing higher, which suggests the rally is not yet exuberant and the path of least resistance remains higher for now. Resistance near 2800 is evident on the monthly chart, as well as the weekly chart, and points out the general area the S&P peaked on three separate occasions from October through December in 2018.
On the monthly chart, an S&P move to 3000 appears even more ambitious than that of the weekly chart but we continue to believe it is far from impossible. That said, a more likely turning point would likely be 2800 or the mid-2900s if the US and China work out their differences. A price of 2940 would match the October highs and could be a tough level to crack. In any case, investors and traders should be aware of the possibility of a continued rally into the 2800 to 3,000 range but should also be willing to pump the brakes on their risk on strategies because just as pessimism peaked in December, there is a good chance optimism will do the same as we approach mid-year, or a the aforementioned price range, whichever comes first.
*THERE IS A SUBSTANTIAL RISK OF FINANCIAL LOSS IN TRADING FUTURES AND OPTIONS.
*There is a substantial risk of loss in trading commodity futures, options, ETFs. Seasonal tendencies are already priced into market values.
There is substantial risk in trading options and futures. Doing so may not be suitable for everyone. These recommendations are a solicitation for entering into derivatives transactions. All known news and events have already been factored into the price of the underlying derivatives discussed. From time to time persons affiliated with Zaner, or its associated companies, may have positions in recommended and other derivatives.
