
As the US-China trade negotiations drag on, and as the official tariffs deadline of March 1 is likely to be extended, there is no denial that last Friday’s price action in the currency space reflects optimism.
Date: 2/25/19
The Daily Edge is authored by Ivan Delgado, Market Insights Commentator at Global Prime. The purpose of this content is to provide an assessment of the market conditions. The report takes an in-depth look of market dynamics, factoring in fundamentals, technicals, inter-market, futures and options, in order to determine daily biases and assist one’s decisions on a regular basis. Feel free to follow Ivan on Twitter & Youtube.
Quick Take
As the US-China trade negotiations drag on, and with the official tariffs deadline of March 1st likely to be extended, there is no denying that last Friday’s price action in the currency space reflects optimism about the outlook for a positive resolution. As a result, the beta currency complex (AUD, NZD, CAD) enjoyed a field day last Friday, with the adjustment in valuations also a clear function of the discounted prices these currencies, especially the Aussie and the Loonie, traded at. The characteristics of the market remain dominated by risk appetite macro wise, with both the Yen and the US Dollar on the back foot as a result.
FX Currency Meter

Narratives in Financial Markets
- Canadian retail sales came better-than-expected on the margin, with a headline of -0.1% vs -0.3% expected. Despite the details of the report were quite poor, it acted as a catalyst to propel the Canadian Dollar as the best performing currency on Friday.
- The EU is preparing retaliation on Xerox (NYSE:XRX), Caterpillar (NYSE:CAT), Samsonite, among other names, should the US decide to put tariffs on European-imported cars.
- US President Trump continues to keep positive semantics on an eventual trade deal, noting that a deal with China ‘is more likely than not’. Trump remains open to the possibility of extending the March 1st deadline if enough progress, which is highly likely. As an anecdote, in live TV, and reported by Bloomberg, we even saw Trump give an earful to US trade chief over a disagreement in the usefulness of having an MOU vs a formal trade agreement contract.
- There were a plethora of Fed speakers lined up on Friday. None of them moved the market. What became clear though, is the unified position on the balance sheet, with further hints provided about a not so distant end to the QT (Quantitative Tightening) process to keep base money at relatively high levels to buffer reserve stocks. Even Fed’s Clarida said the Central Bank will review new tools not used before like capping Treasury yields.
- On the Brexit saga, with the deadline for the UK to leave the European Union just a month away, the absence of any substantial progress remains the norm. According to Bloomberg, a vote on a new Brexit deal this new week is very unlikely as positions remain far apart. There are some reports suggesting a 21-month Brexit delay might be considered.
- The headline that led to NZD weakness earlier on Friday was due to the RBNZ noting that higher bank capital reserves may lead to an eventual rate cut. Taken into context, the headline was conditional and hinged to other elements that had to happen first, so eventually, the market dismissed the comments and the beta currencies (NZD, AUD, CAD) recovered.
- China’s foreign ministry spokesman Geng Shuang said in a news conference Friday that “I would like to clarify reports China had banned Australian coal imports) are false”.
Economic Indicators Ahead
Find below a list of the key news events that may act as a stimulant to move markets this week.

Source: Forexfactory
RORO - Risk On Risk Off Conditions
, 30-Yr. US T-Bill")

The microflows have reverted back to an environment of USD weakness in a context of rising equities. Such a backdrop is positive for beta currencies as seen by the robust recovery in the likes of the Canadian Dollar, the Kiwi and the Australian Dollar. If we add on top of the micro flows the macro ‘true risk on’ layer, we can start to rationalize with a higher degree of logic the move seen. Both the most short-term timeframes based off 1-day worth of price action (25-HMA slope), as well as the guidance based on 1-week worth of price information (125-HMA slope), both show the same direction as global equities remain well underpinned on the hopes of a US-China trade deal.
Dashboard: Intermarket Flows & Technical Analysis


When it comes to the exchange of flows between the Euro and the US Dollar, it remains a market-makers territory. In other words, the lack of impetus and fundamental-driven stimulants to create enough demand/supply imbalances is keeping the pair range-bound, with the cluster of bids and offers at the extremities, for now, able to exploit the low engagement activity. A reflection of this low activity is the neutral measurements assigned to most of the technical/intermarket elements monitored in today’s forex outlook table above. Not a pretty market to trade unless range trading.

The V-shaped rebound in the Sterling should be perceived, to a certain degree, on the basis of a market in an overall bullish context which had entered oversold conditions. What’s most important, two critical pillars that have determined the pair’s value in recent weeks (DXY, Yield Spread) were still in a macro trend based on the 5-DMA, which represented an excellent price point to engage in buy-side action given the discrepancy in the pricing of the GBP/USD. The more adventurous, system-driven could have just been filled limit orders while the more discretionary type, could have drilled down to lower timeframes to find evidence that the market was ready to revert back up. The recovery in the DXY (inverted) depicted in blue is supportive going forward barring Brexit headlines.

If trading the EUR/USD has been such a low-key affair for the last 3 days, don’t get me started on the USD/JPY. It doesn’t mean trading opportunities are not existent, it just means that one must adapt to the present range-bound market conditions. With a backdrop dominated by risk appetite conditions, these two are the currencies the market is the least incentivized to resort to, which has led to a relatively low interest to find a resolution from its week-long range. Overall, with macro ‘true risk on’ conditions still the name of the game, while shorter-term we need to contend with USD weakness, this is a market not enjoying the right background to breakout in either direction this Monday.

The Aussie met all the prerequisites for an adjustment in value to the upside last Friday. Whenever we get a market so oversold as the Aussie was, with the added incongruence of a fundamental-driven catalyst (Australian coal imports ban to China) later denied by both sides, and on top of that, the macro scene (5-DMA slope) still look constructive based on the mood in the equity market coupled with a rising Yuan, lower US Dollar index, the risk of a significant rebound was evident. As we enter a new week of trading, the backdrop remains positive, hence even if the last sell-off created an impulsive movement that qualifies as a valid bearish cycle, the conditions are far from ideal to engage in sell-side action ‘hoping’ that a retest of the lows can occur unless the rampant dynamics in the S&P 500, the DXY or the Aussie-US yield spread exhibit spontaneous sharp reversals.

A similar bearish story setting up since Friday, which has also played out fantastically well in line with the discrepancies spotted in intermarket studies was the USD/CAD. Any swing or day trader with an interest to engage at relatively cheap prices with the trend would have probably been all over this short trade, as the conditions were just pristine. We saw a bullish trap during the Asian session, by price breaking up the descending trendline, only for the price to be smashed back down as the market re-anchored its support towards the Canadian Dollar in line with a macro positive backdrop in Oil prices and a gloomy one on the US Dollar, both exhibiting 5-DMA slopes supportive of a lower USD/CAD. Remember, if the slow stoch enter, in this case, overbought conditions, while intermarket signals argue to support the opposite direction, that’s what we understand as price offered at a discount and it makes for interesting exploitable trade opportunities.

In terms of Gold prices, the U-turn lower in the US yields alongside the matched downside movement in the DXY did suffice to see flows back into the appeal of Gold. At this stage, as the correlation coefficients demonstrate, gold continues to be treated as a function of USD weakness, with the correlation against the DXY in crescendo for the last 10 days or so, current just under 70%. Ever since the last FOMC minutes, when US yield received its last major catalyst, Gold has also been tracking in lock-steps the inverted performance of the short-dated US yields as a proxy for Fed funds pricing.

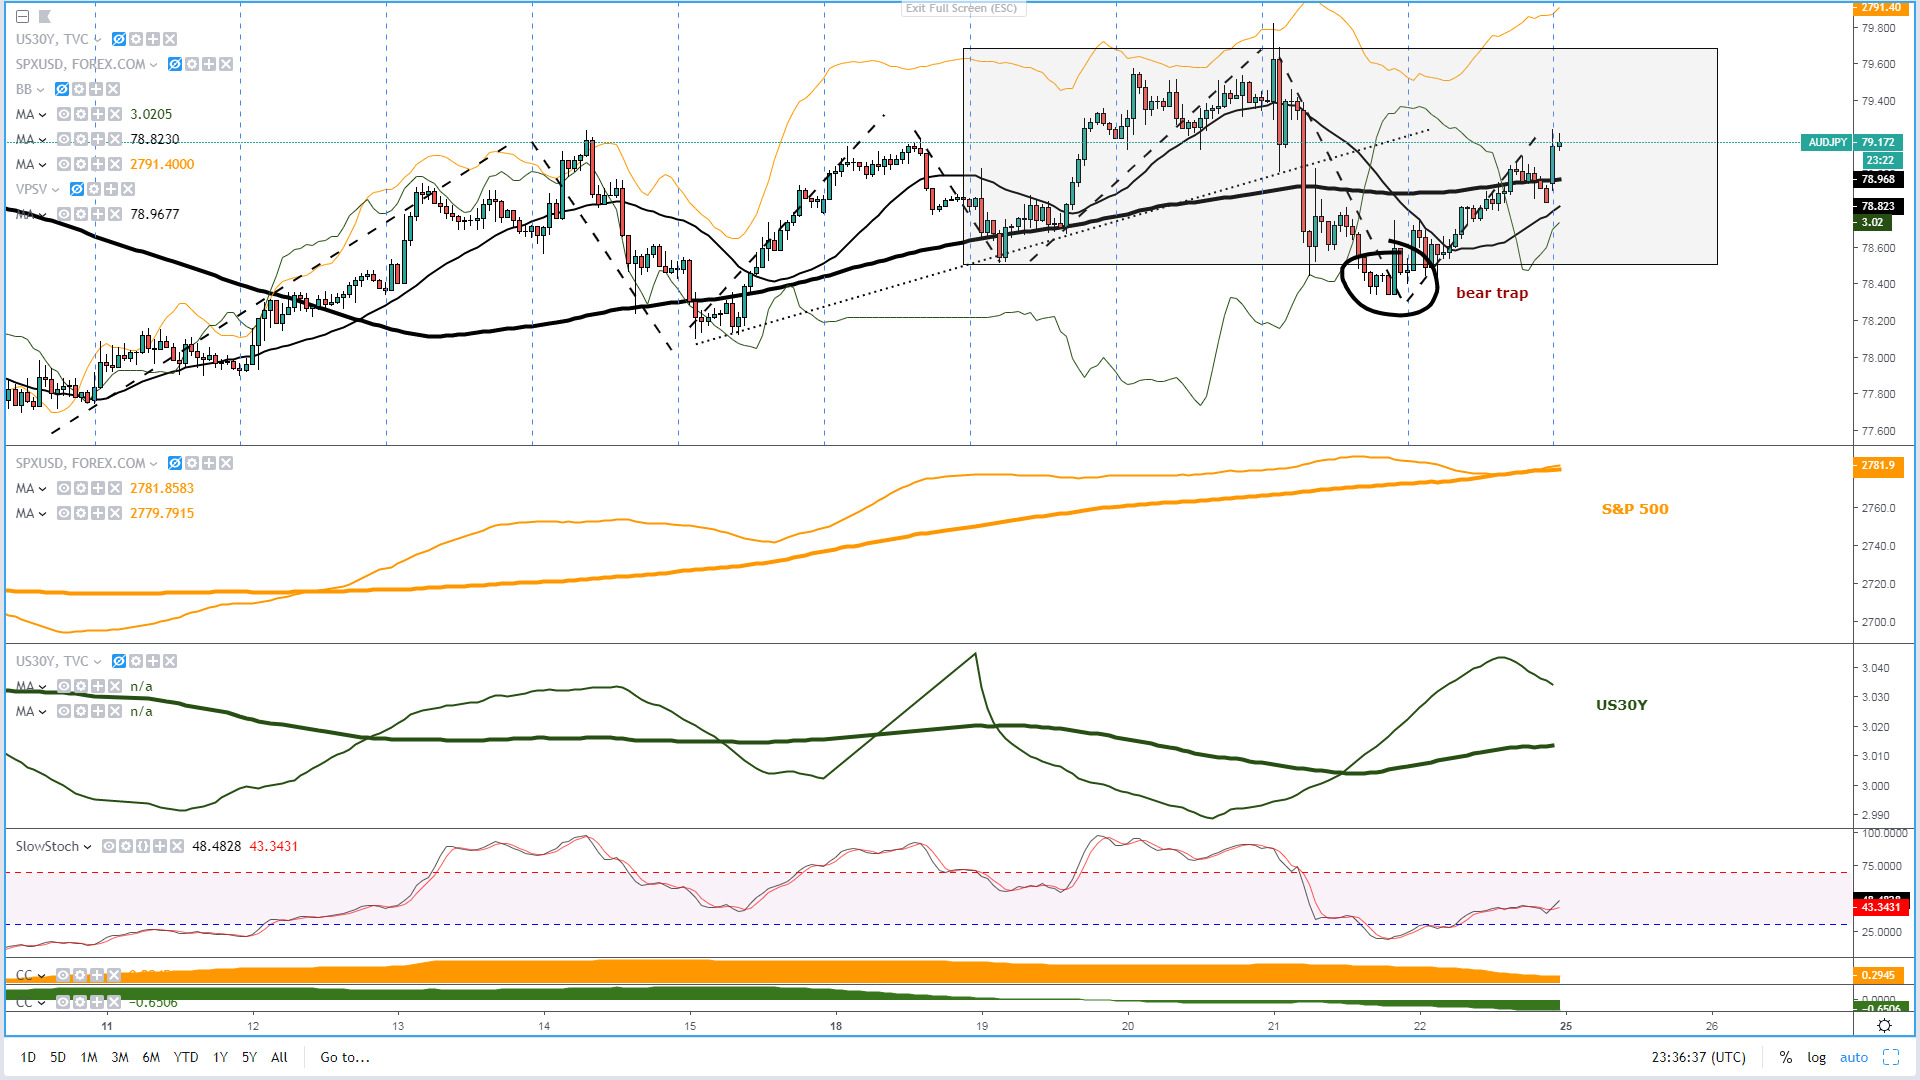
The AUD/JPY, similarly to the AUD/USD, was a market that had written all over the wall clear signs of cheap prices being offered to engage in the buy-side activity if one judges the correction lower as being an abnormal event in disagreement with the rising slope of the intermarket macro trends. As a result, fast forward to Monday’s Asian trade, and the pair is trading over 80 pips from its recent low.
At the risk of repeating myself to death, I will argue that the vigorous rebound in the EUR/AUD also faced analogous bearish conditions to be unsustainable, this time simply predicated on the dominant 5-day trend (125-HMA slope) in the USD/CNH, alongside the uptrend in the S&P 500. Note, this is a market paying a lot more attention to the state of fundamentals in the Australian economy, that’s why we are seeing Aussie flows now tracking much more closely the AU-US bond yield spread, so that’s definitely, together with the VIX/SP500 and the Yuan, a third element to monitor.

Lastly, for those trading the Kiwi, as in the case of the Australian Dollar, this is a market that is starting to look a lot more inwards to determine the next directional bias. By inward, what I mean is that the flows in the NZD/USD are being determined by the trajectory of the NZ-US bond yield spread. So, with the micro slope having recovered to the bullish side in the last 24h, but with the macro outlook in terms of the yield spread not conclusive, breaking 69c will still prove a tall order.

Important Footnotes
- Risk model: The fact that financial markets have become so intertwined and dynamic makes it essential to stay constantly in tune with market conditions and adapt to new environments. This prop model will assist you to gauge the context that you are trading so that you can significantly reduce the downside risks. To understand the principles applied in the assessment of this model, refer to the tutorial How to Unpack Risk Sentiment Profiles
- Cycles: Markets evolve in cycles followed by a period of distribution and/or accumulation. The weekly cycles are highlighted in red, blue refers to the daily, while the black lines represent the hourly cycles. To understand the principles applied in the assessment of cycles, refer to the tutorial How To Read Market Structures In Forex
- POC: It refers to the point of control. It represents the areas of most interest by trading volume and should act as walls of bids/offers that may result in price reversals. The volume profile analysis tracks trading activity over a specified time period at specified price levels. The study reveals the constant evolution of the market auction process. If you wish to find out more about the importance of the POC, refer to the tutorial How to Read Volume Profile Structures
- Tick Volume: Price updates activity provides great insights into the actual buy or sell-side commitment to be engaged into a specific directional movement. Studies validate that price updates (tick volume) are highly correlated to actual traded volume, with the correlation being very high, when looking at hourly data. If you wish to find out more about the importance tick volume, refer to the tutorial on Why Is Tick Volume Important To Monitor?
- Horizontal Support/Resistance: Unlike levels of dynamic support or resistance or more subjective measurements such as fibonacci retracements, pivot points, trendlines, or other forms of reactive areas, the horizontal lines of support and resistance are universal concepts used by the majority of market participants. It, therefore, makes the areas the most widely followed and relevant to monitor. The Ultimate Guide To Identify Areas Of High Interest In Any Market
- Trendlines: Besides the horizontal lines, trendlines are helpful as a visual representation of the trend. The trendlines are drawn respecting a series of rules that determine the validation of a new cycle being created. Therefore, these trendline drawn in the chart hinge to a certain interpretation of market structures.
- Correlations: Each forex pair has a series of highly correlated assets to assess valuations. This type of study is called inter-market analysis and it involves scoping out anomalies in the ever-evolving global interconnectivity between equities, bonds, currencies, and commodities. If you would like to understand more about this concept, refer to the tutorial How Divergence In Correlated Assets Can Help You Add An Edge.
- Fundamentals: It’s important to highlight that the daily market outlook provided in this report is subject to the impact of the fundamental news. Any unexpected news may cause the price to behave erratically in the short term.
- Projection Targets: The usefulness of the 100% projection resides in the symmetry and harmonic relationships of market cycles. By drawing a 100% projection, you can anticipate the area in the chart where some type of pause and potential reversals in price is likely to occur, due to 1. The side in control of the cycle takes profits 2. Counter-trend positions are added by contrarian players 3. These are price points where limit orders are set by market-makers. You can find out more by reading the tutorial on The Magical 100% Fibonacci Projection