
Best Buy Company, Inc. (NYSE:BBY) reported robust fourth-quarter fiscal 2020 results, wherein the top and the bottom line surpassed the Zacks Consensus Estimate and improved year over year. Notably, this marked the ninth straight quarter of earnings beat.
Management is encouraged about its fiscal 2021 plan, remaining on track to accomplish fiscal 2025 financial goals of $50 billion in revenues and a 5% adjusted operating income rate.
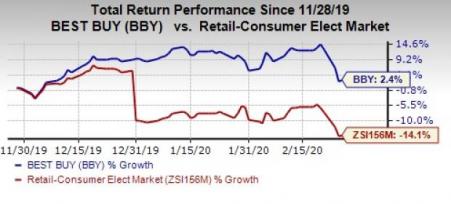
Markedly, shares of the company marginally increased during the pre-market trading session on Feb 27. In the past three months, shares of this Zacks Rank #2 (Buy) company have increased 2.4% against the industry’s 14.1% decline.
Let’s Delve Deeper
This consumer electronics retailer posted adjusted earnings per share of $2.90, surpassing the Zacks Consensus Estimate of $2.76. Moreover, the bottom line improved 7% year over year, courtesy of higher revenues and lower adjusted SG&A expenses.
On a GAAP basis, earnings per share came in at $2.84, up 6% from the year-ago quarter.
The company’s Enterprise revenues grew 2.7% year over year to $15,196 million and also beat the consensus mark of $15,087 million. Enterprise comparable sales were up 3.2% compared with 3% growth recorded in the prior-year quarter. Notably, the quarter marked the company’s 12th consecutive quarter of comparable sales growth.
Moreover, the company recorded gross profit of $3,235 million, down 1.5% year over year. Also, gross margin contracted 90 basis points (bps) to 21.3%. Further, adjusted operating income dropped 0.8% to $986 million owing to adjusted operating margin contraction of 20 bps to 6.5%.
Best Buy Co., Inc. Price, Consensus and EPS Surprise
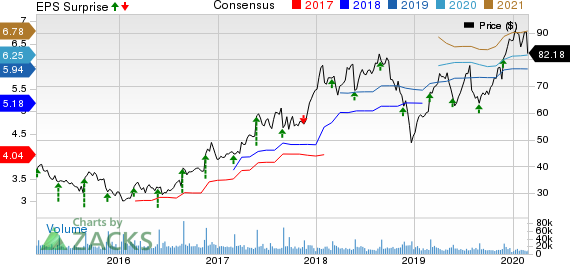
Best Buy Co., Inc. price-consensus-eps-surprise-chart | Best Buy Co., Inc. Quote
Segment Details
Domestic segment revenues rose 2.6% year over year to $13,848 million, driven by higher comparable sales, somewhat offset by loss of revenue owing to store closures over the past year. The segment recorded comparable sales growth of 3.4%, backed by higher sales in headphones, appliances, computing, mobile phones and tablets, partly negated by a decline in gaming.
Additionally, comparable online sales at this division increased 18.7% to $3.52 billion, mainly owing to a rise in average order values as well as higher traffic and conversion rates. As a percentage of overall Domestic revenues, online revenues grew nearly 350 bps to 25.4% compared with 21.9% recorded in the prior-year quarter.
However, the segment’s gross margin contracted 90 bps year over year to 21.2% due to mix into lower-margin products, reduced gross margin in the services category and adverse impact of tariffs on goods imported from China.
International segment revenues increased 3.4% to $1,348 million, mainly owing to the favorable impact of foreign currency to the tune of approximately 160 bps. Also, the company recorded comparable sales increase of 1.6% on growth in Canada. The segment’s gross margin contracted roughly 30 bps to 22.6%.
Other Financial Details
Best Buy ended the quarter with cash and cash equivalents of $2,229 million, long-term debt of $1,257 million and total equity of $3,479 million. In the fiscal fourth quarter, the company returned about $436 million to shareholders via share buybacks of $307 million and dividend payouts of $129 million. For the full fiscal, Best Buy returned $1.53 billion through buybacks of $1 billion and dividend payouts of $527 million.
In addition, the company’s board of directors approved a 10%-hike in its quarterly dividend to 55 cents per share. The new dividend will be payable Apr 9, 2020, to shareholders of record as on Mar 19. In fiscal 2021, management intends to spend between $750 million and $1.0 billion with respect to share repurchases.
Guidance
Best Buy issued guidance for the first quarter and fiscal 2021. Management cited that as the company enters fiscal 2021, it has been monitoring developments associated with the coronavirus outbreak. Based on the current situation, majority of the impact is likely to occur in the first half.
For fiscal 2021, Best Buy forecasts Enterprise revenues of $43.3-$44.3 billion compared with $43.6 billion recorded last fiscal. Furthermore, Enterprise comparable sales growth is expected to be flat to up 2% compared with 2.1% increase in fiscal 2020.
Moreover, the company expects gross margin to remain flat, while SG&A rate is likely to be up slightly year over year. Further, adjusted operating income rate is likely to come in at 4.8%. Adjusted effective income tax rate is anticipated at 23.0%. Adjusted earnings per share for the fiscal year are envisioned in the band of $6.10-$6.30, the mid-point of which — $6.20 — is below the current Zacks Consensus Estimate of $6.25.
For the fiscal first quarter, management anticipates Enterprise revenues of $9.1-$9.2 billion and comparable sales growth of flat to up 1%. The adjusted effective income tax rate is expected at nearly 22.5%. Management expects first-quarter adjusted earnings per share of $1-$1.05. The current Zacks Consensus Estimate for the same is pegged at 99 cents.
More Key Picks in Retail
Stitch Fix (NASDAQ:SFIX) has an impressive long-term expected earnings growth rate of 15% and currently sports a Zacks Rank #1 (Strong Buy). You can see the complete list of today’s Zacks #1 Rank stocks here.
Zumiez (NASDAQ:ZUMZ) , also a Zacks Rank #1 stock, has an expected long-term earnings growth rate of 12%
Big Lots (NYSE:BIG) has a long-term earnings growth rate of 7.7% and a Zacks Rank #2.
Today's Best Stocks from Zacks
Would you like to see the updated picks from our best market-beating strategies? From 2017 through 2019, while the S&P 500 gained and impressive +53.6%, five of our strategies returned +65.8%, +97.1%, +118.0%, +175.7% and even +186.7%.
This outperformance has not just been a recent phenomenon. From 2000 – 2019, while the S&P averaged +6.0% per year, our top strategies averaged up to +54.7% per year.
See their latest picks free >>
Best Buy Co., Inc. (BBY): Free Stock Analysis Report
Big Lots, Inc. (BIG): Free Stock Analysis Report
Zumiez Inc. (ZUMZ): Free Stock Analysis Report
Stitch Fix, Inc. (SFIX): Free Stock Analysis Report
Original post
Zacks Investment Research